For sustainability, ESG & procurement teams

Food is your biggest Scope 3 lever. Measure all of it.

CHEF measures every dish and ingredient on the EU’s own Environmental Footprint method: climate, land, water and resources, across all 16 indicators. One set of figures for your Scope 3 inventory, CSRD and nature disclosures, client tenders and the claims on your menus.

EU EF 3.1 methodAgribalyse 3.2 dataGHG Protocol aligned
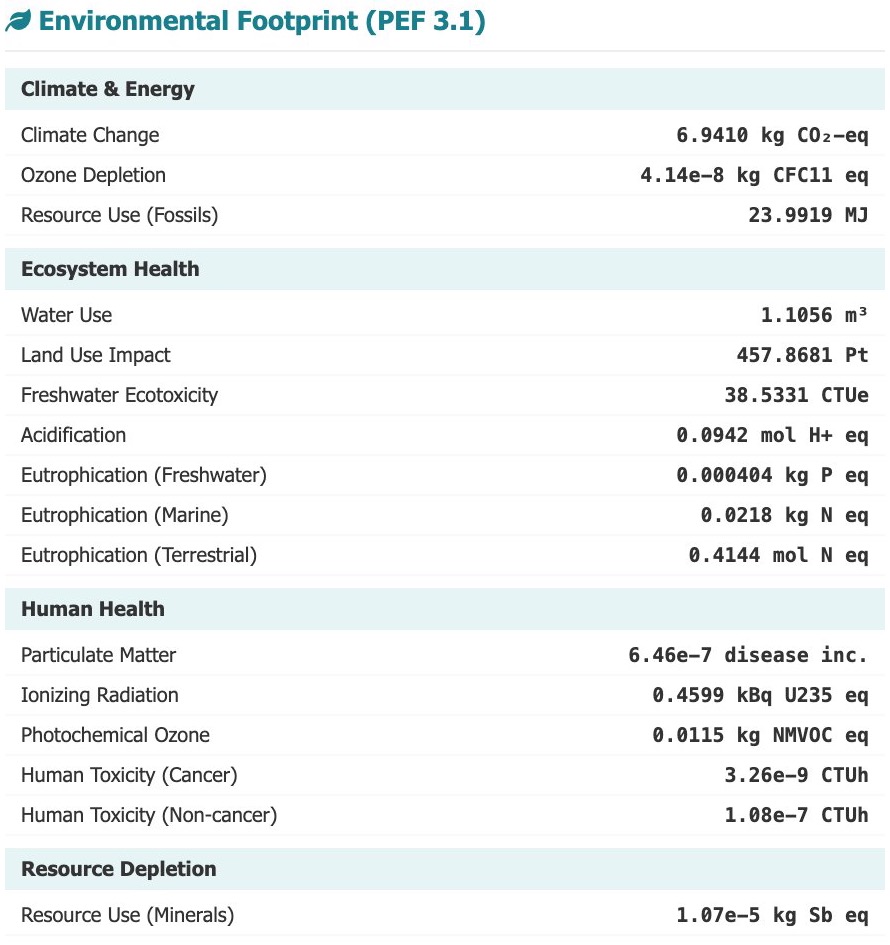
CHEF Pro certificate excerpt: all 16 Environmental Footprint indicators for one dish, each in its own unit, from climate change in kg CO2e to mineral resource use in kg Sb eq
16 indicators · per serving
Why food data matters now

Three pressures, one dataset.

Food sits where carbon accounting, nature reporting and consumer law meet. Measuring it once, on a recognised method, covers all three.

Scope 3 & CSRD

The largest slice is the least measured.

Purchased food is often the biggest Scope 3 category for hotels and caterers. It is also the category most often estimated from spend rather than measured.

Large groups reporting under CSRD need figures from their outlets and catering partners.

CSRD scope as amended by Omnibus I, Directive (EU) 2026/470
Nature reporting

Carbon alone won’t answer the nature questions.

ESRS E3 (water) and E4 (biodiversity), and the ISSB’s nature work built on TNFD, ask about land use, water and pollution. Those are farming’s biggest pressures, and CHEF measures them for every dish.

ISSB nature-related disclosures, drawing on the TNFD framework
Green claims, from 27 Sept 2026

“Eco-friendly” now needs evidence.

EU rules on generic environmental claims apply from 27 September 2026. Replace vague wording with specific, method-based figures: “Rated A across all 16 EU environmental indicators” says something you can show.

Directive (EU) 2024/825. This is not legal advice: check claims with counsel.
What the inventory shows
49%
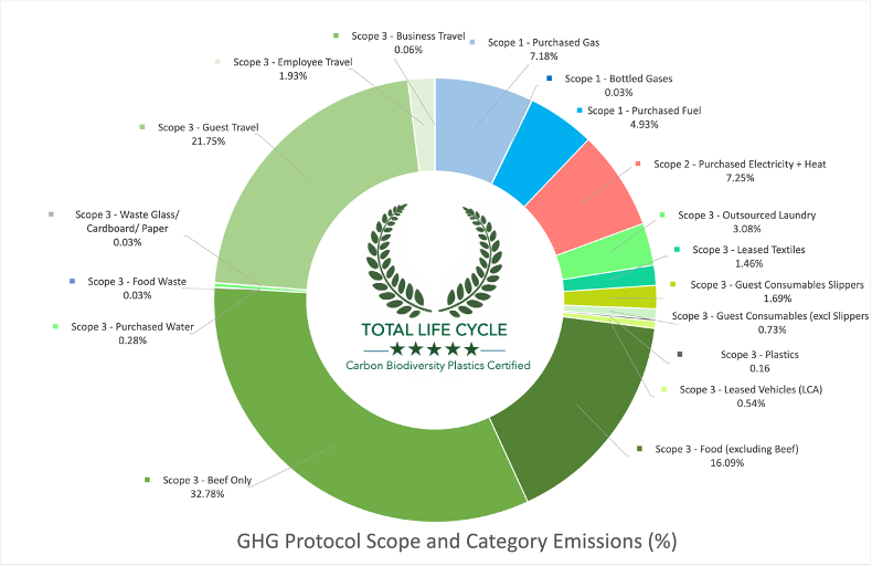
of Celtic Manor Resort’s on-site emissions came from food and beverage.
32.8%beef alone
16.1%all other food
19.4%all energy: gas, fuel, electricity and heat

Shares of the resort’s total, read from the chart: food is Scope 3, energy is Scopes 1 and 2. Food outweighs all on-site energy use by more than two to one.

“Until we got in Total Life Cycle we did not comprehend that the largest reduction in on-site emissions in the shortest time could be through adjusting our menus.”Managing Director, Celtic Manor Resort

We have worked with leading hospitality, travel and healthcare organisations

Virgin Atlantic Hyatt Regency Great Ormond Street Hospital easyJet UN Tourism Jamaica Tourism Sustainable Markets Initiative Equinox St Thomas' Hospital The Celtic Collection Cooperativa Guatemala Global Travel and Tourism Resilience Council Cityscape Global
One method, every framework

Measure once. Use it everywhere you report.

Every CHEF result is built from the same 16 EU Environmental Footprint indicators, so the figure in your Scope 3 inventory, your CSRD report and your client tender all come from the same data.

FrameworkWhat it asks about foodCHEF indicators that supply it
GHG Protocol Scope 3Category 1, purchased goodsGreenhouse gas emissions of the food you buy
Climate change, kg CO₂e
CSRD, ESRS E1Climate changeGross Scope 3 emissions and reduction targets
Climate change, kg CO₂e
CSRD, ESRS E3Water & marine resourcesWater use in water-stressed areas and water pollution
Water use (scarcity-weighted)Freshwater eutrophicationMarine eutrophication
CSRD, ESRS E4 · TNFD · ISSB natureBiodiversity & ecosystemsLand-use pressure and pollution reaching ecosystems
Land useAcidificationTerrestrial eutrophicationFreshwater ecotoxicity
CSRD, ESRS E2PollutionPollutants released to air, water and soil
Particulate matterPhotochemical ozoneHuman toxicity
CSRD, ESRS E5Resource useUse of fossil and mineral resources
Resource use, fossilsResource use, minerals & metals
Tenders & green claimsClients, guests, EU Directive 2024/825Specific, evidenced performance in place of generic wording
A–E grade from all 16PDF certificatePublished method

CHEF provides data for these disclosures. It is not a reporting platform or an assurance service. Which datapoints you must report depends on your own materiality assessment.

From menu to report

Four steps from recipe to reported figure.

Bring in the menus

Import recipes from your costing software by spreadsheet, or build dishes from a name or a menu photo.

CHEF

Measure each dish

All 16 indicators per serving, with each ingredient’s share, so you can see where the footprint sits.

CHEF

Export the data

Menu Overview CSV for every dish. Pro adds an ingredient-level CSV with all 16 indicators in native units.

CHEF

Scale to your year

Multiply per-serving figures by covers sold or purchase volumes, then roll them into your inventory, or let TLC do it.

You or TLC
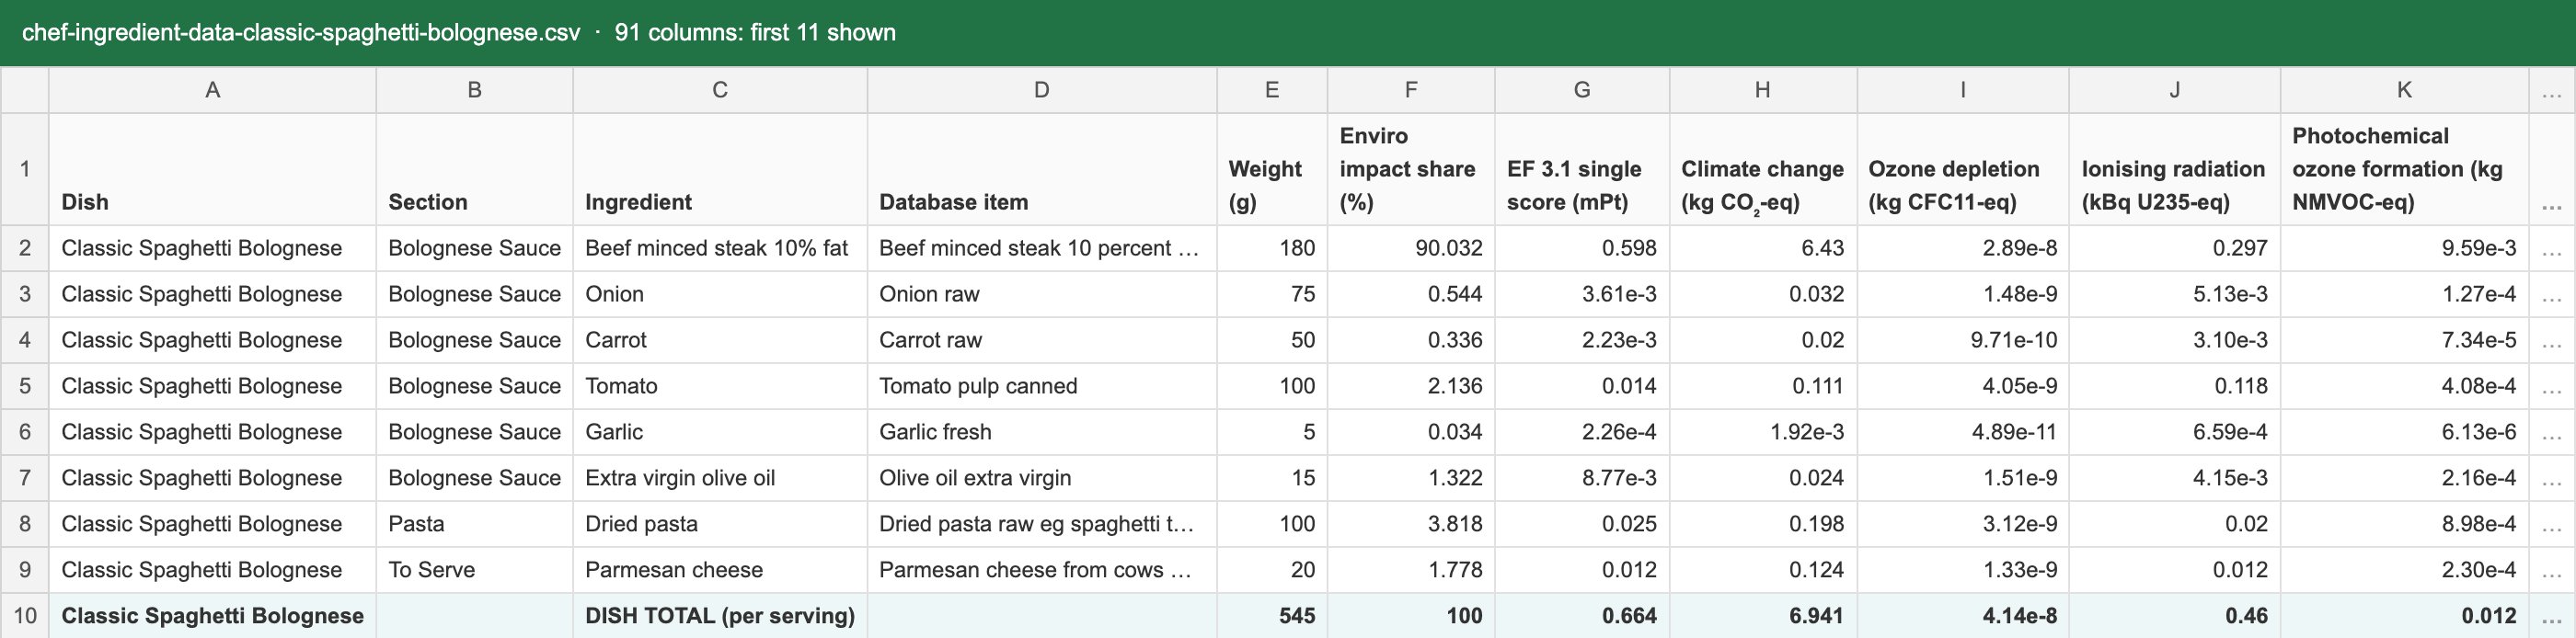
Ingredient-level CSV export: one row per ingredient with weight, impact share, EF 3.1 single score and each indicator, plus a dish total row

Menu Overview CSV Lite

One row per dish: grade, EF 3.1 single score, kg CO₂e, land, water and resources grades, nutrition, cost, GP and kg CO₂e per unit of gross profit.

Ingredient data CSV Pro

91 columns per ingredient, including all 16 PEF indicators in their own units, every nutrient, the database item matched and a dish total row. Ready for your own analysis.

PDF certificate Pro

Four pages per dish, with the method version and issue date stamped on every page. Built to attach to tenders and client reports.

Method & data

A recognised method, shown in full.

No black box: every figure traces back to a public database and the EU’s published method.

Impact methodEU Environmental Footprint 3.1: 16 indicators, EU normalisation and weighting
LCA dataAgribalyse 3.2 (ADEME), cradle to plate, 2,500+ foods
Nutrition dataCiqual 2025 (ANSES)
Functional unitOne serving, as weighed in the recipe
Single scoreMilli-points (mPt) of the EF single score. Grade bands are set against a fair share for one main meal.
VersioningMethod version printed on every certificate (currently 2026.10)

Built for

  • Scope 3 Category 1 using the GHG Protocol average-data method
  • Finding hotspots and ranking dishes and menus
  • Comparing swaps, portions and organic or origin choices
  • Substantiating specific claims on menus and in tenders

For supplier-specific figures

  • Average data reflects typical European production, not a named farm
  • TLC Certified adds your purchasing records and supplier data
Read the full methodology →
Two ways to work

Run it yourself, or have it done for you.

Self-service

CHEF Pro

£21 for 12 months per user. Group invoicing available.
  • All 16 indicators per dish, on screen and on the certificate
  • Ingredient-level CSV export
  • Four-page PDF certificates and dish comparisons
  • Nutrition labels for 10 markets
Done for you

TLC Certified

From £350 for venues under 50 staff. Larger properties and groups by quote.
  • TLC analysts review your bills, menus, water and sourcing data
  • Whole-venue Scope 1, 2 & 3 footprint to the GHG Protocol
  • Biodiversity and plastics assessment beyond F&B
  • Report and TLC Certified badge
TLC Certified badgeThe assessment behind the Celtic Manor Resort breakdown above.
Reporting questions

Before you rely on the numbers

Is CHEF data suitable for a Scope 3 inventory?

Yes, for Category 1 purchased food using the GHG Protocol’s average-data method: weight of food × an emission factor from a recognised database. CHEF’s factors come from Agribalyse 3.2. Where you hold supplier-specific data, use it for those items.

How do I get annual totals?

Export per-serving figures and multiply them by covers sold or by purchased weights in your spreadsheet or reporting tool. TLC Certified does this for you, from your sales and purchasing records.

Will an auditor accept it?

Auditors look for a documented method, traceable sources and consistent application. CHEF publishes its method, names the database item behind every ingredient and stamps the method version on each certificate. Assurance itself is up to your auditor.

Why report beyond carbon?

Climate change is about a fifth of the EU’s weighting. Land use, water and nutrient pollution are where food has its biggest effect on nature, and they are what ESRS E3 and E4 and nature-related disclosures ask about.

Can we use the grades in marketing?

Specific, method-based statements are far stronger than generic “eco” wording, especially under the EU rules applying from September 2026. Always state the method and check claims with your legal adviser.

Put your food footprint on the record.

Assess a menu in minutes, or talk to TLC about a full property assessment.

CHEF is also for

Hotels & restaurantsMenu Carbon Labels for Hotels & RestaurantsStudents & lecturersFree Food Sustainability Tool for Students
CHEFCalculator for Health, Environment and Food

Free A–E grades for climate, land and water from all 16 EU PEF indicators, with nutrition and allergens.

Who it’s for

Using CHEF

TLC Analytics