For hotels, restaurants & caterers

Every dish on your menus, graded for climate, land and water.

From breakfast buffet to banqueting, CHEF grades each dish on all 16 EU environmental indicators, not just carbon, with cost, GP, nutrition and allergens alongside. Ready for menus, guest labels and reports. Free to start.

Climate Land Water Energy & resources Nutrition
No sign-up to startResults in under 2 minutesWhole menus by spreadsheet
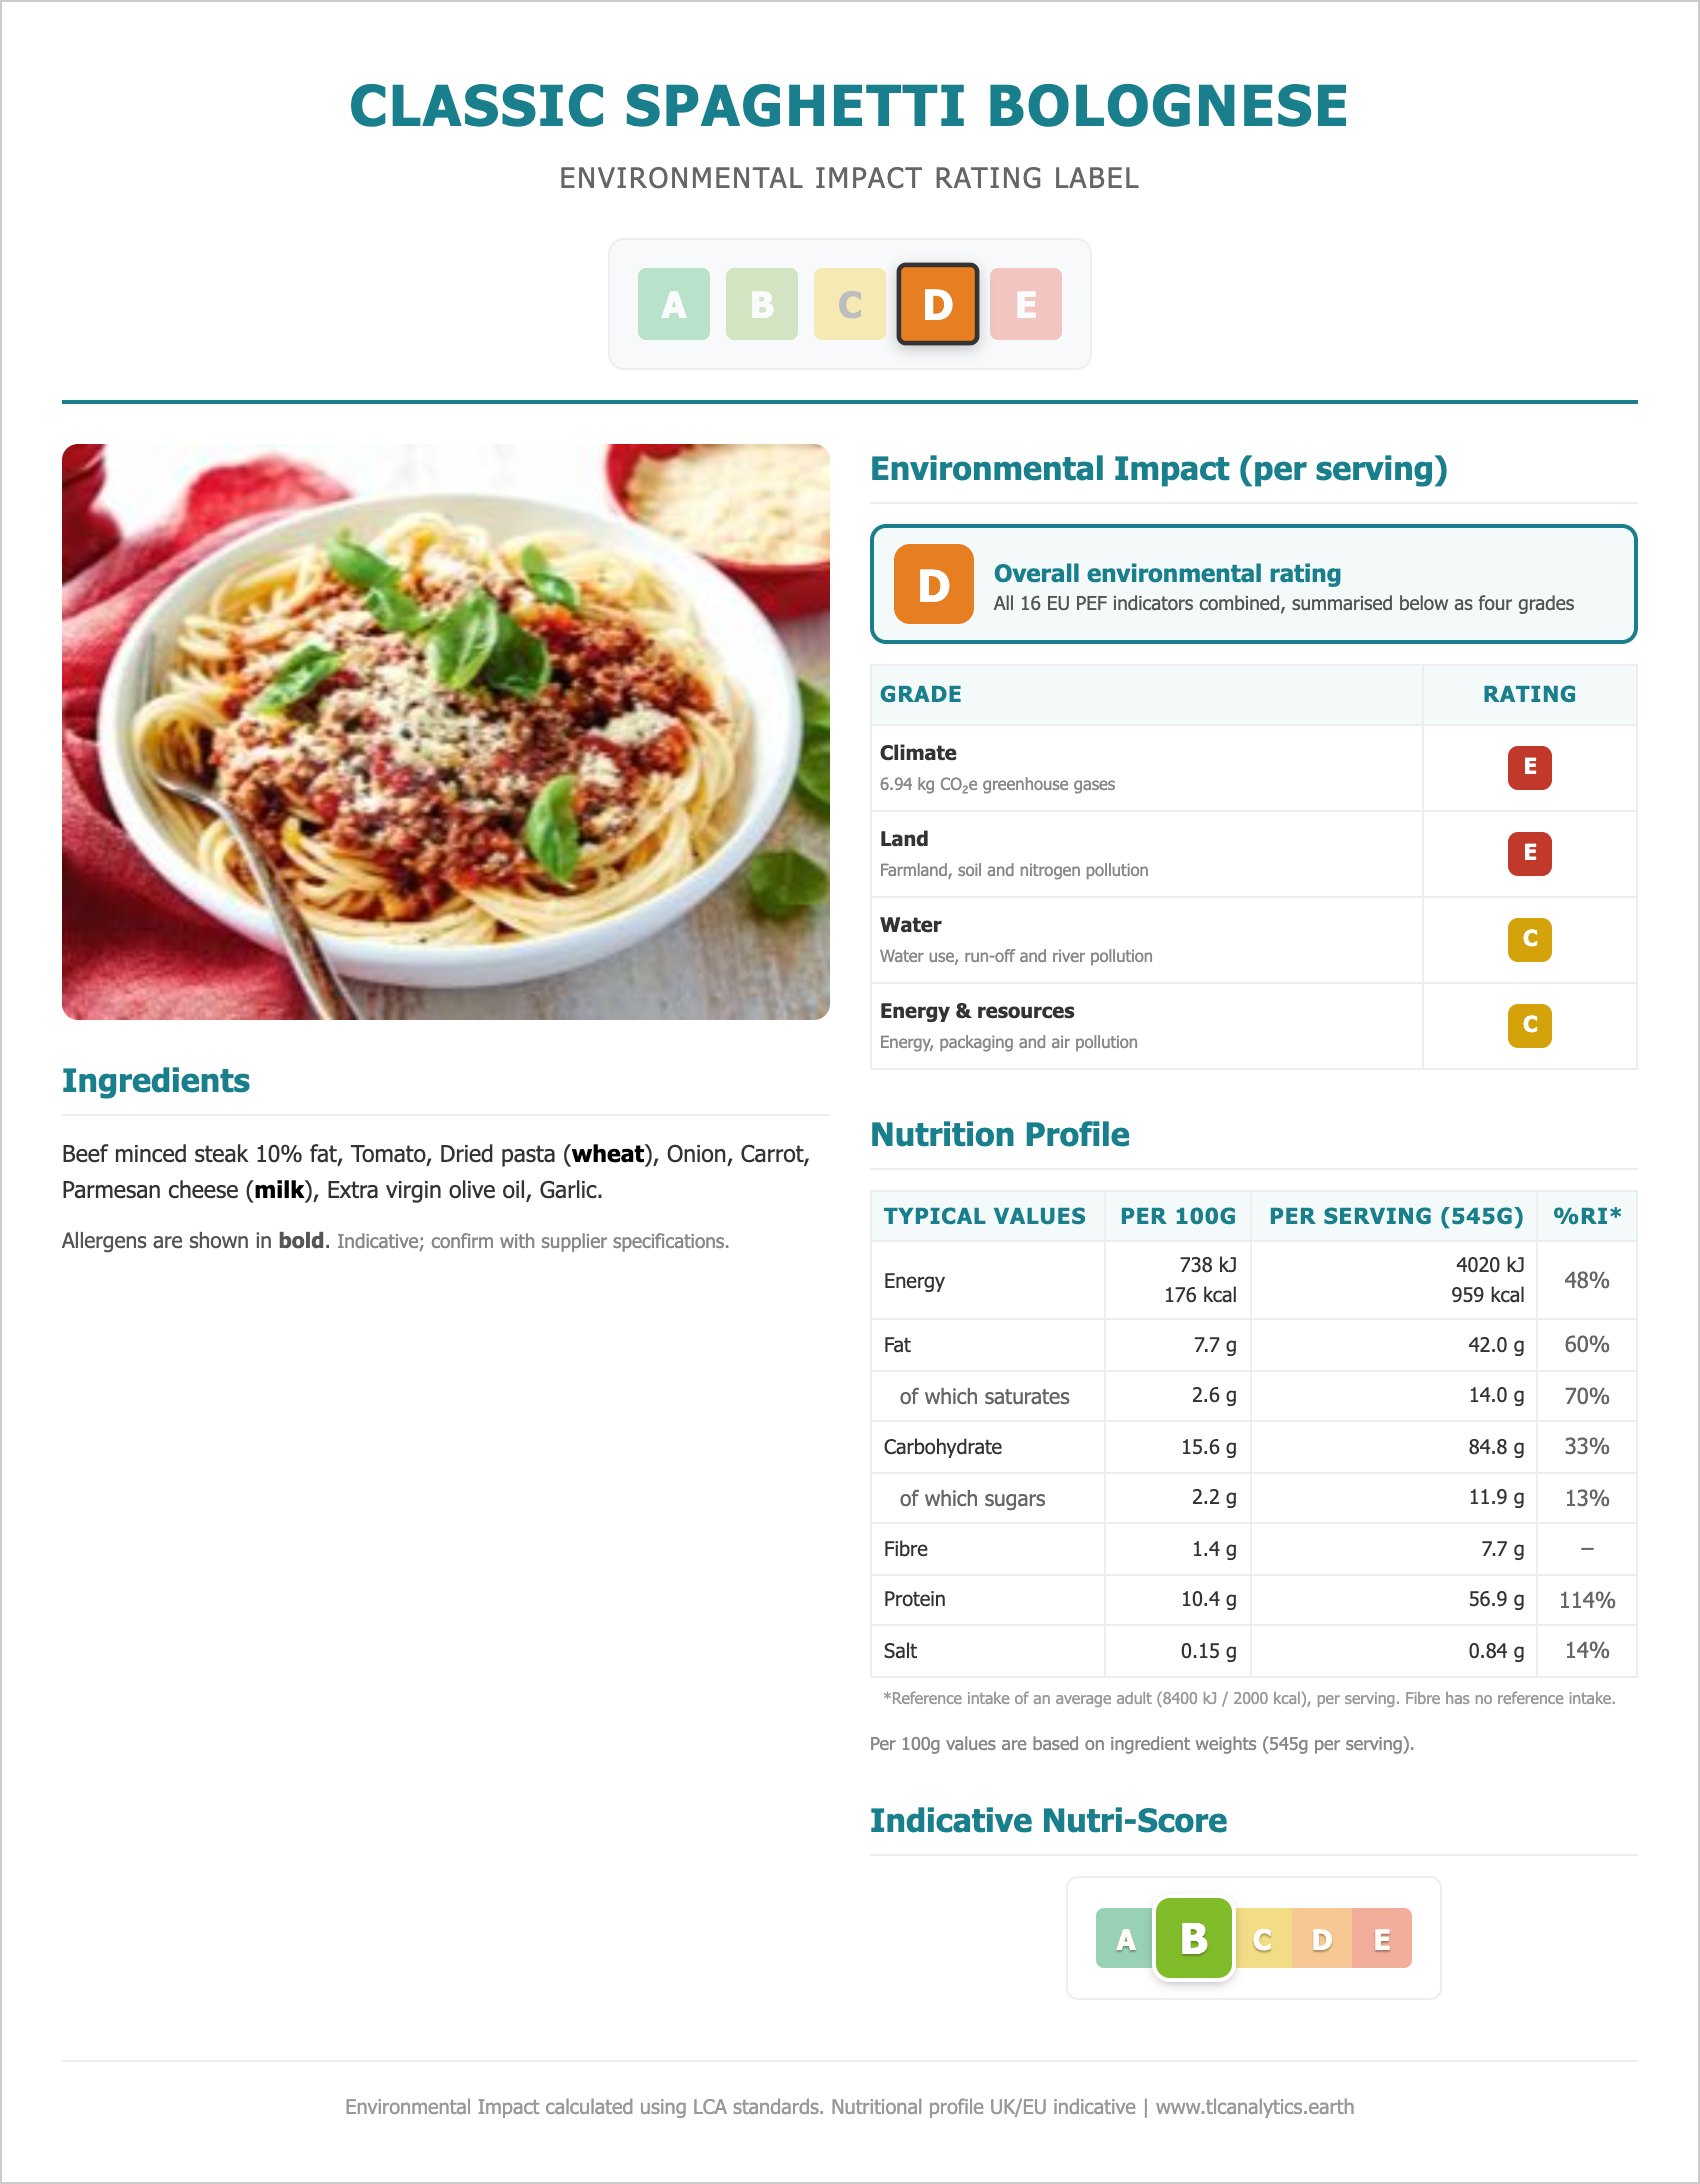
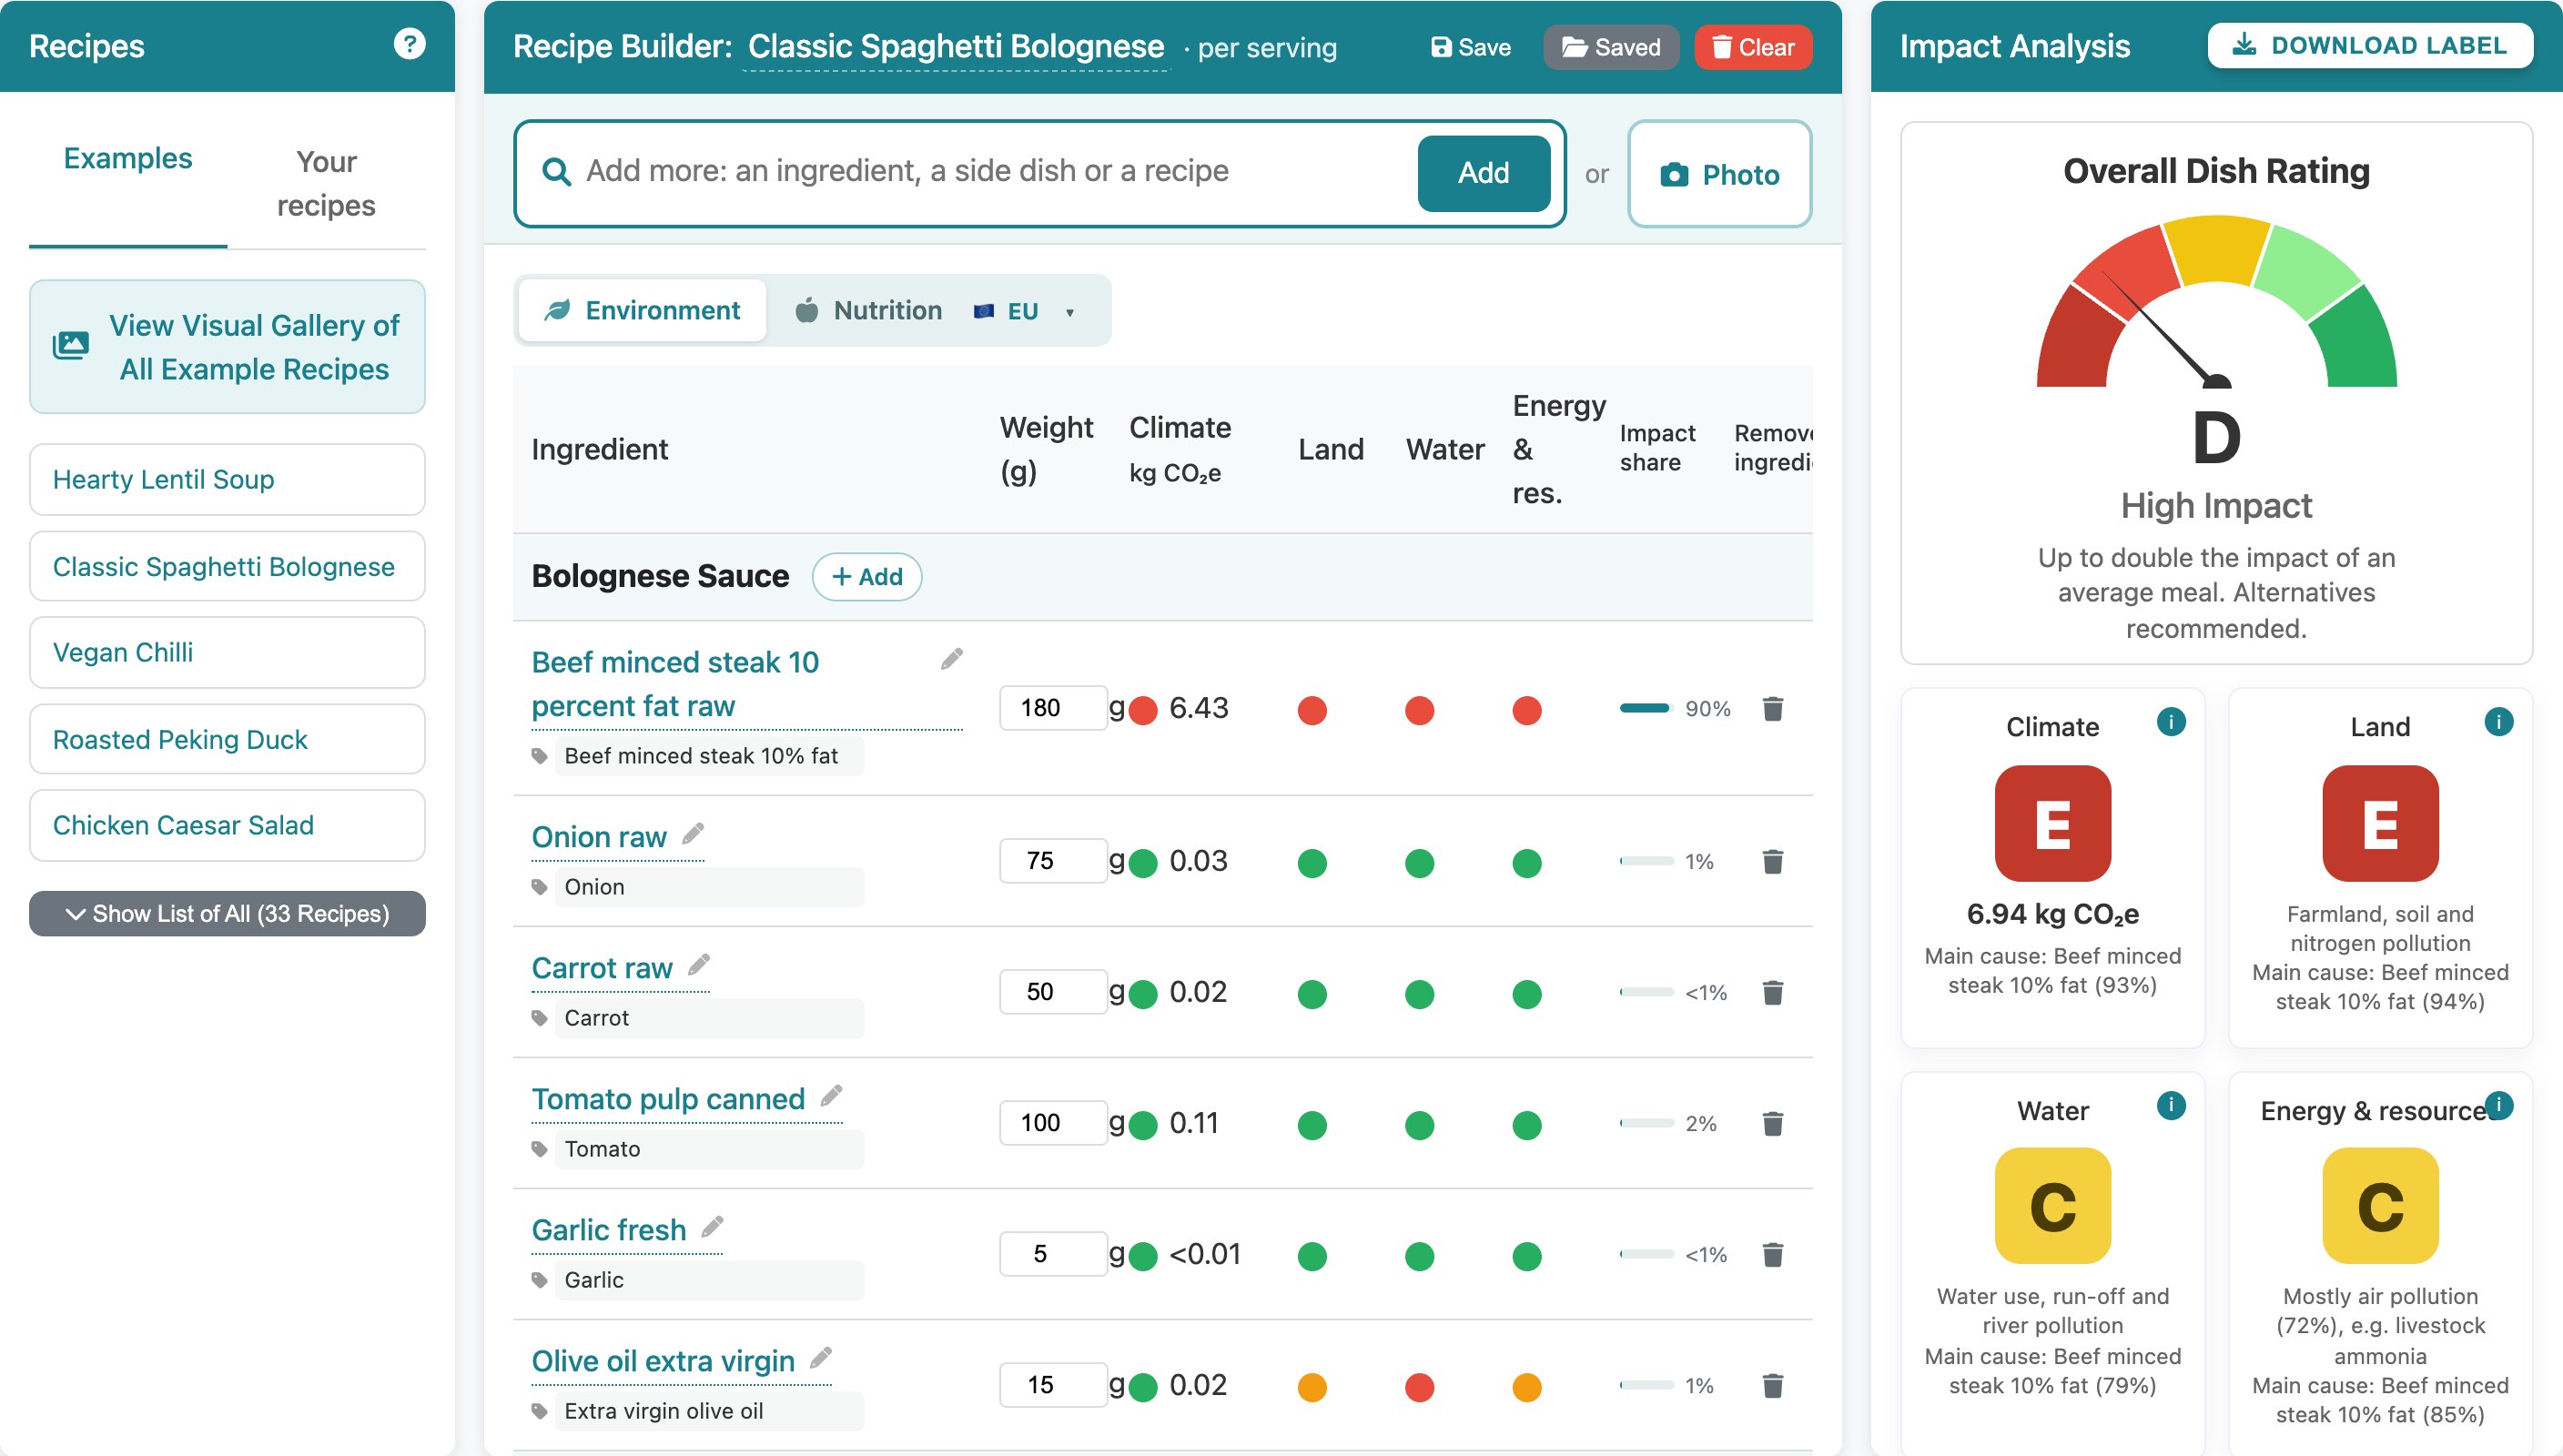
CHEF calculator: Classic Spaghetti Bolognese graded D overall, with Climate E, Land E, Water C and Energy and resources C
Where hotels can act fastest
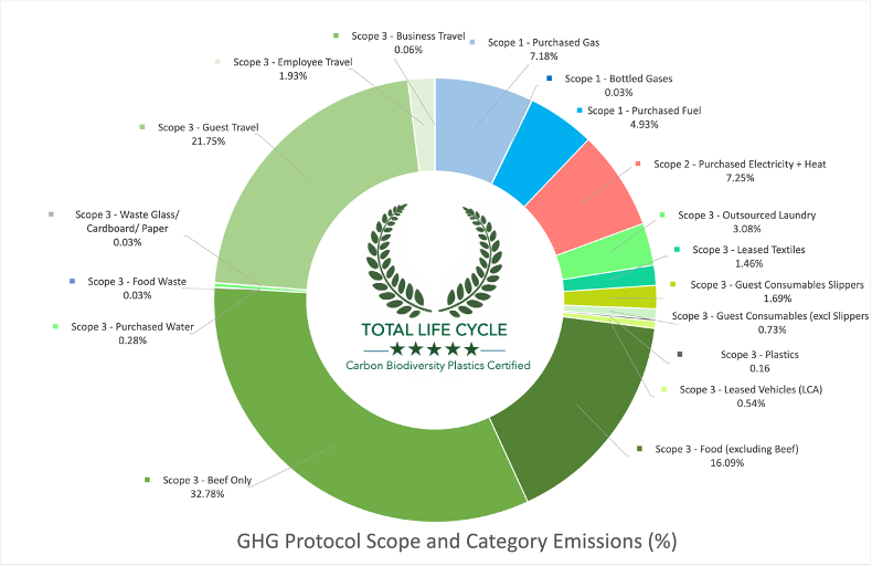
49%
of Celtic Manor Resort’s on-site emissions came from food and beverage.
  • More than electricity, heating and waste combined. In TLC’s hotel assessments, F&B is consistently the largest on-site source.
  • Changes this season, not in five years. A menu change needs no capital spending or building works.
  • Guests see it. Unlike a heat pump, a better dish ends up on the guest’s plate and on the menu.
“Until we got in Total Life Cycle we did not comprehend that the largest reduction in on-site emissions in the shortest time could be through adjusting our menus. F&B was over 50% of our hotel spa’s footprint.”Managing Director, Celtic Manor Resort

We have worked with leading hospitality, travel and healthcare organisations

Virgin Atlantic Hyatt Regency Great Ormond Street Hospital easyJet UN Tourism Jamaica Tourism Sustainable Markets Initiative Equinox St Thomas' Hospital The Celtic Collection Cooperativa Guatemala Global Travel and Tourism Resilience Council Cityscape Global
What makes CHEF different

Carbon is one impact. Your menu has sixteen.

Most food calculators stop at kg CO₂e. Farming’s biggest pressures on nature (soil, nitrogen, water scarcity and river pollution) never show up in a carbon figure. CHEF scores all 16 EU Product Environmental Footprint indicators and turns them into grades a kitchen can use.

Climate

Greenhouse gases from farm to plate, in kg CO₂e. This is the figure your Scope 3 report needs.

1 indicator · 21% of the EU weighting

Land

Farmland taken up, soil quality, acidification and nitrogen settling on fields and habitats. This is the main driver of biodiversity loss.

3 indicators · 18% of the EU weighting

Water

Water use weighted by local scarcity, fertiliser run-off to rivers and the sea, and pesticide toxicity in freshwater.

4 indicators · 16% of the EU weighting
Plus Energy & resources (8 indicators, 45%). See all 16
  • Climate change
  • Land use
  • Acidification
  • Terrestrial eutrophication
  • Water use
  • Freshwater eutrophication
  • Marine eutrophication
  • Freshwater ecotoxicity
  • Resource use, fossils
  • Resource use, minerals & metals
  • Particulate matter
  • Photochemical ozone
  • Ozone depletion
  • Ionising radiation
  • Human toxicity, cancer
  • Human toxicity, non-cancer
Close to home

Carbon goes global. Land and water stay local.

A dish’s carbon mixes into one global atmosphere. Its land and water impacts happen where the food is grown: in the soils, rivers, coastline and wildlife of the region you buy from. For a hotel or restaurant that champions local farms, those are the impacts guests can see out of the window.

CHEF shows which ingredients put the most pressure on land and water, so you know which suppliers to ask about farming practice, and which swaps protect the place your guests came to enjoy.

CHEF uses Agribalyse 3.2 average farm data. Use it alongside what your own suppliers tell you about their practices.

Same dish, different stories
Ingredient (impact per kg)ClimateLandWaterE&R
Beef mince
Extra virgin olive oil
Tomato, canned

From the Classic Spaghetti Bolognese in CHEF. Olive oil looks fine on carbon but stands out on land and water. A carbon-only tool would never show you that.

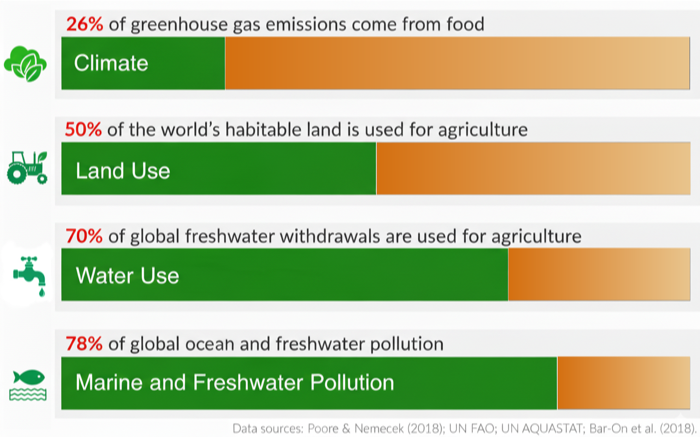
Share of global impacts from food: greenhouse gases, land use, freshwater withdrawals and eutrophication (Our World in Data)

Food’s footprint is mostly not carbon.

Food systems produce about a quarter of global greenhouse gases. They also use half of the world’s habitable land, account for 70% of freshwater withdrawals and cause 78% of the nutrient pollution in rivers, lakes and seas.

Source: Poore & Nemecek (2018), Science, via Our World in Data

Sectors

Built around how your kitchen works.

The same dish data serves a hotel’s five outlets, a restaurant group’s seasonal change or a hospital’s patient menu.

One property, many kitchens.

A hotel’s F&B footprint is spread across outlets with different menus, guests and margins. CHEF lets you grade each outlet, compare them side by side and focus on the dishes that matter most.

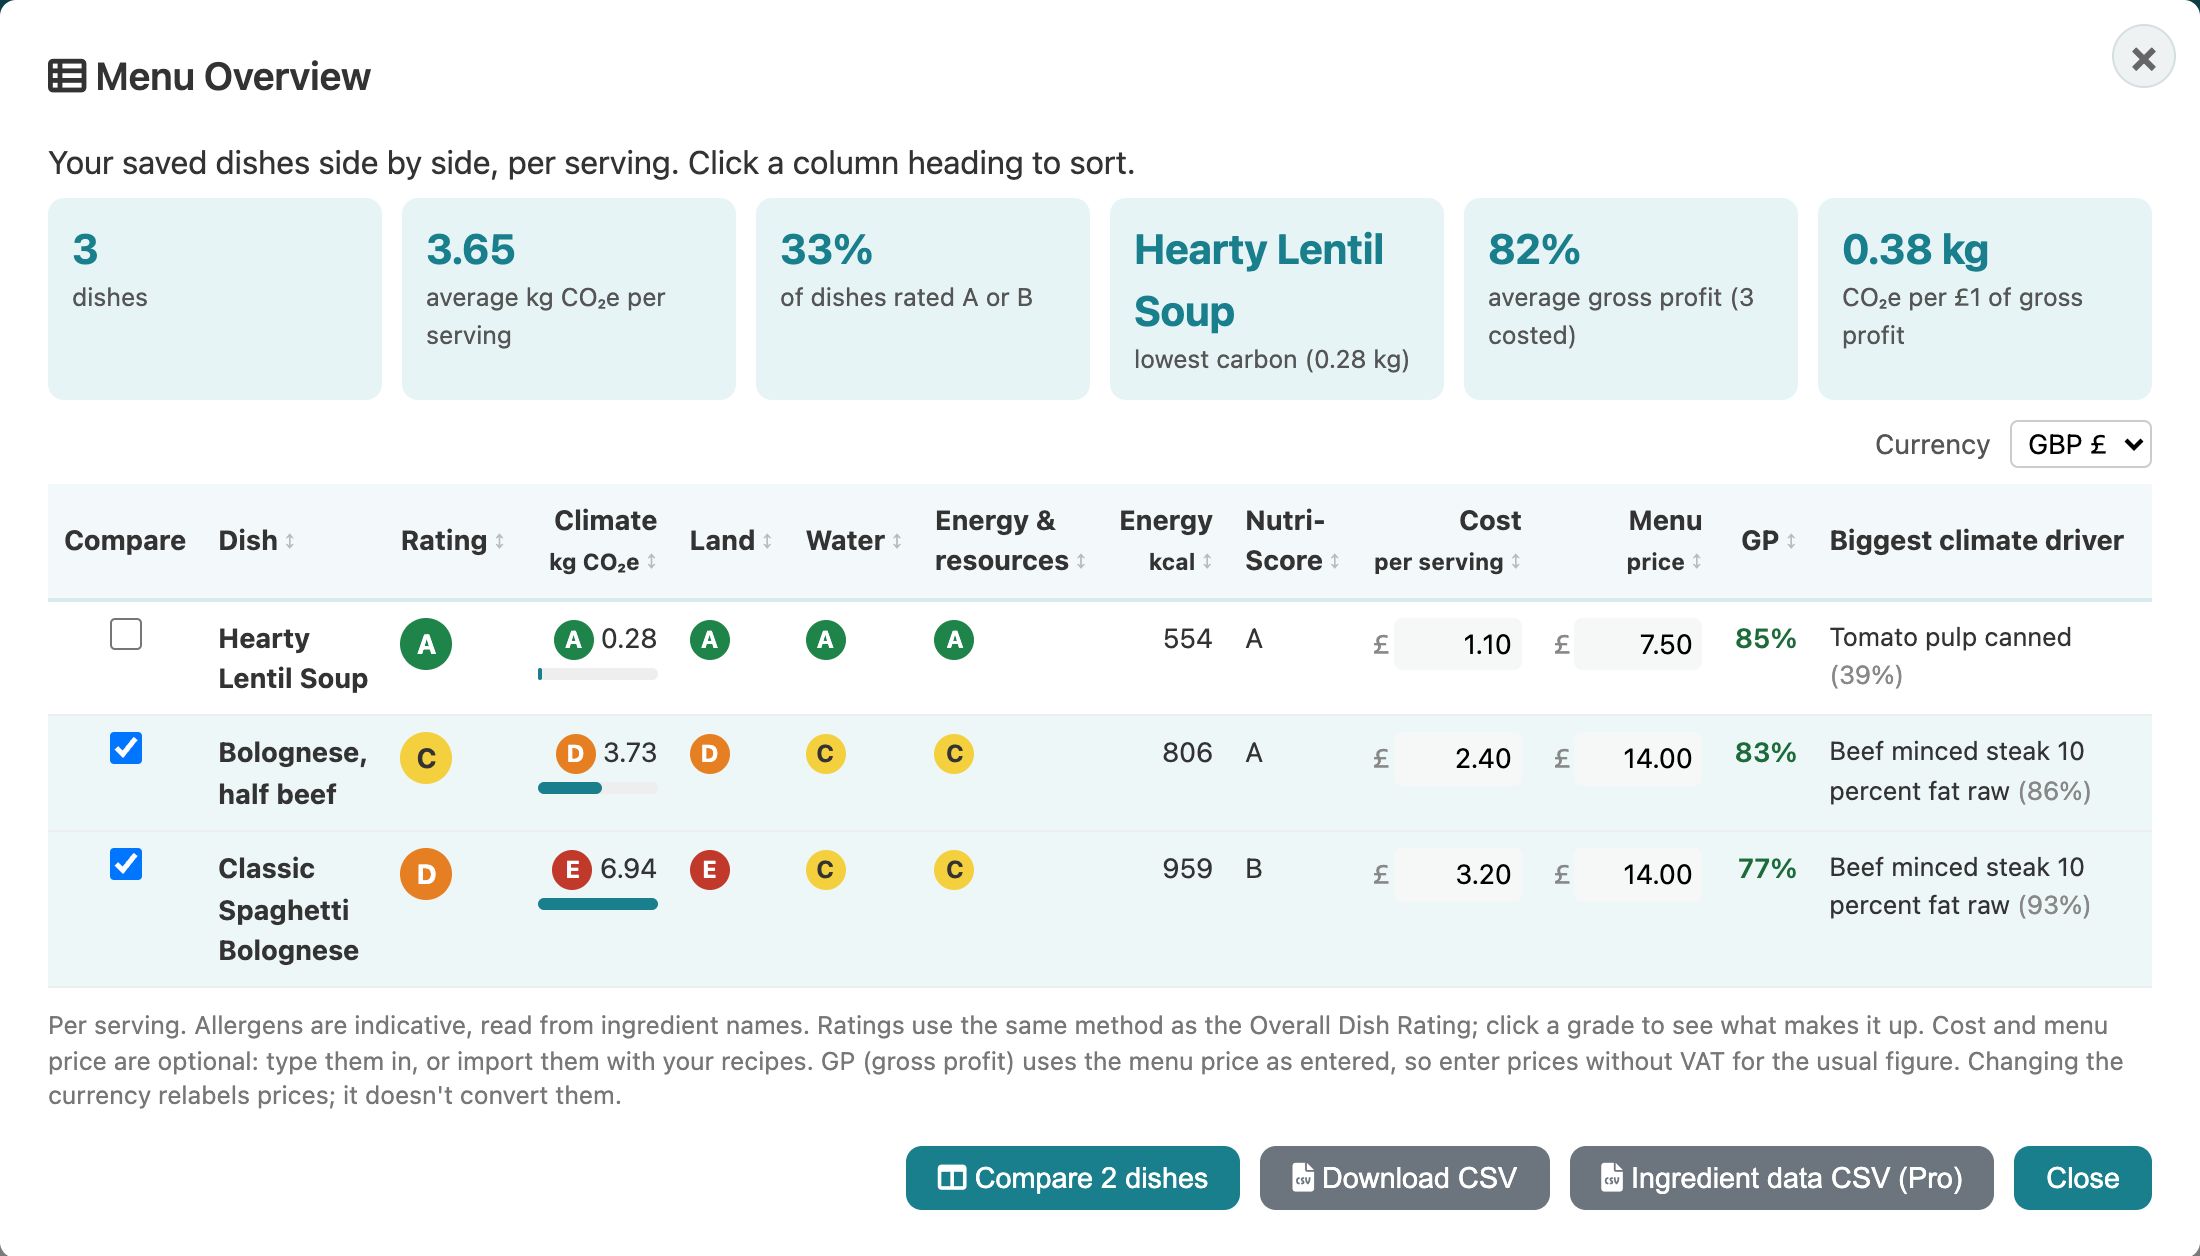
  • Outlet by outlet: save each outlet’s menu and compare grades, cost and GP in Menu Overview.
  • Banqueting and events: offer clients graded set menus for proposals and RFPs.
  • Scope 3 and certification: per-dish data feeds a whole-property GHG Protocol footprint, or TLC can audit the property for you.
  • Local and seasonal stories: back up your sourcing with land and water grades, not just carbon.
Breakfast & buffetGrade per guest portion. Small swaps make a big difference at this volume.
All-day diningThe core menu, with labels guests can read at a glance.
Fine diningTasting menus that show provenance as well as flavour.
Banqueting & eventsGraded set menus to put in proposals and client reports.
Room serviceA short menu where one dish can shift the whole score.
Bar & loungeBar snacks and small plates.
Spa & wellnessNutrition and environment together for wellness-minded guests.
Staff canteenOften the busiest kitchen in the building, and the easiest place to start.
How it works

From recipe to menu label in three steps.

1

Add a dish or a whole menu

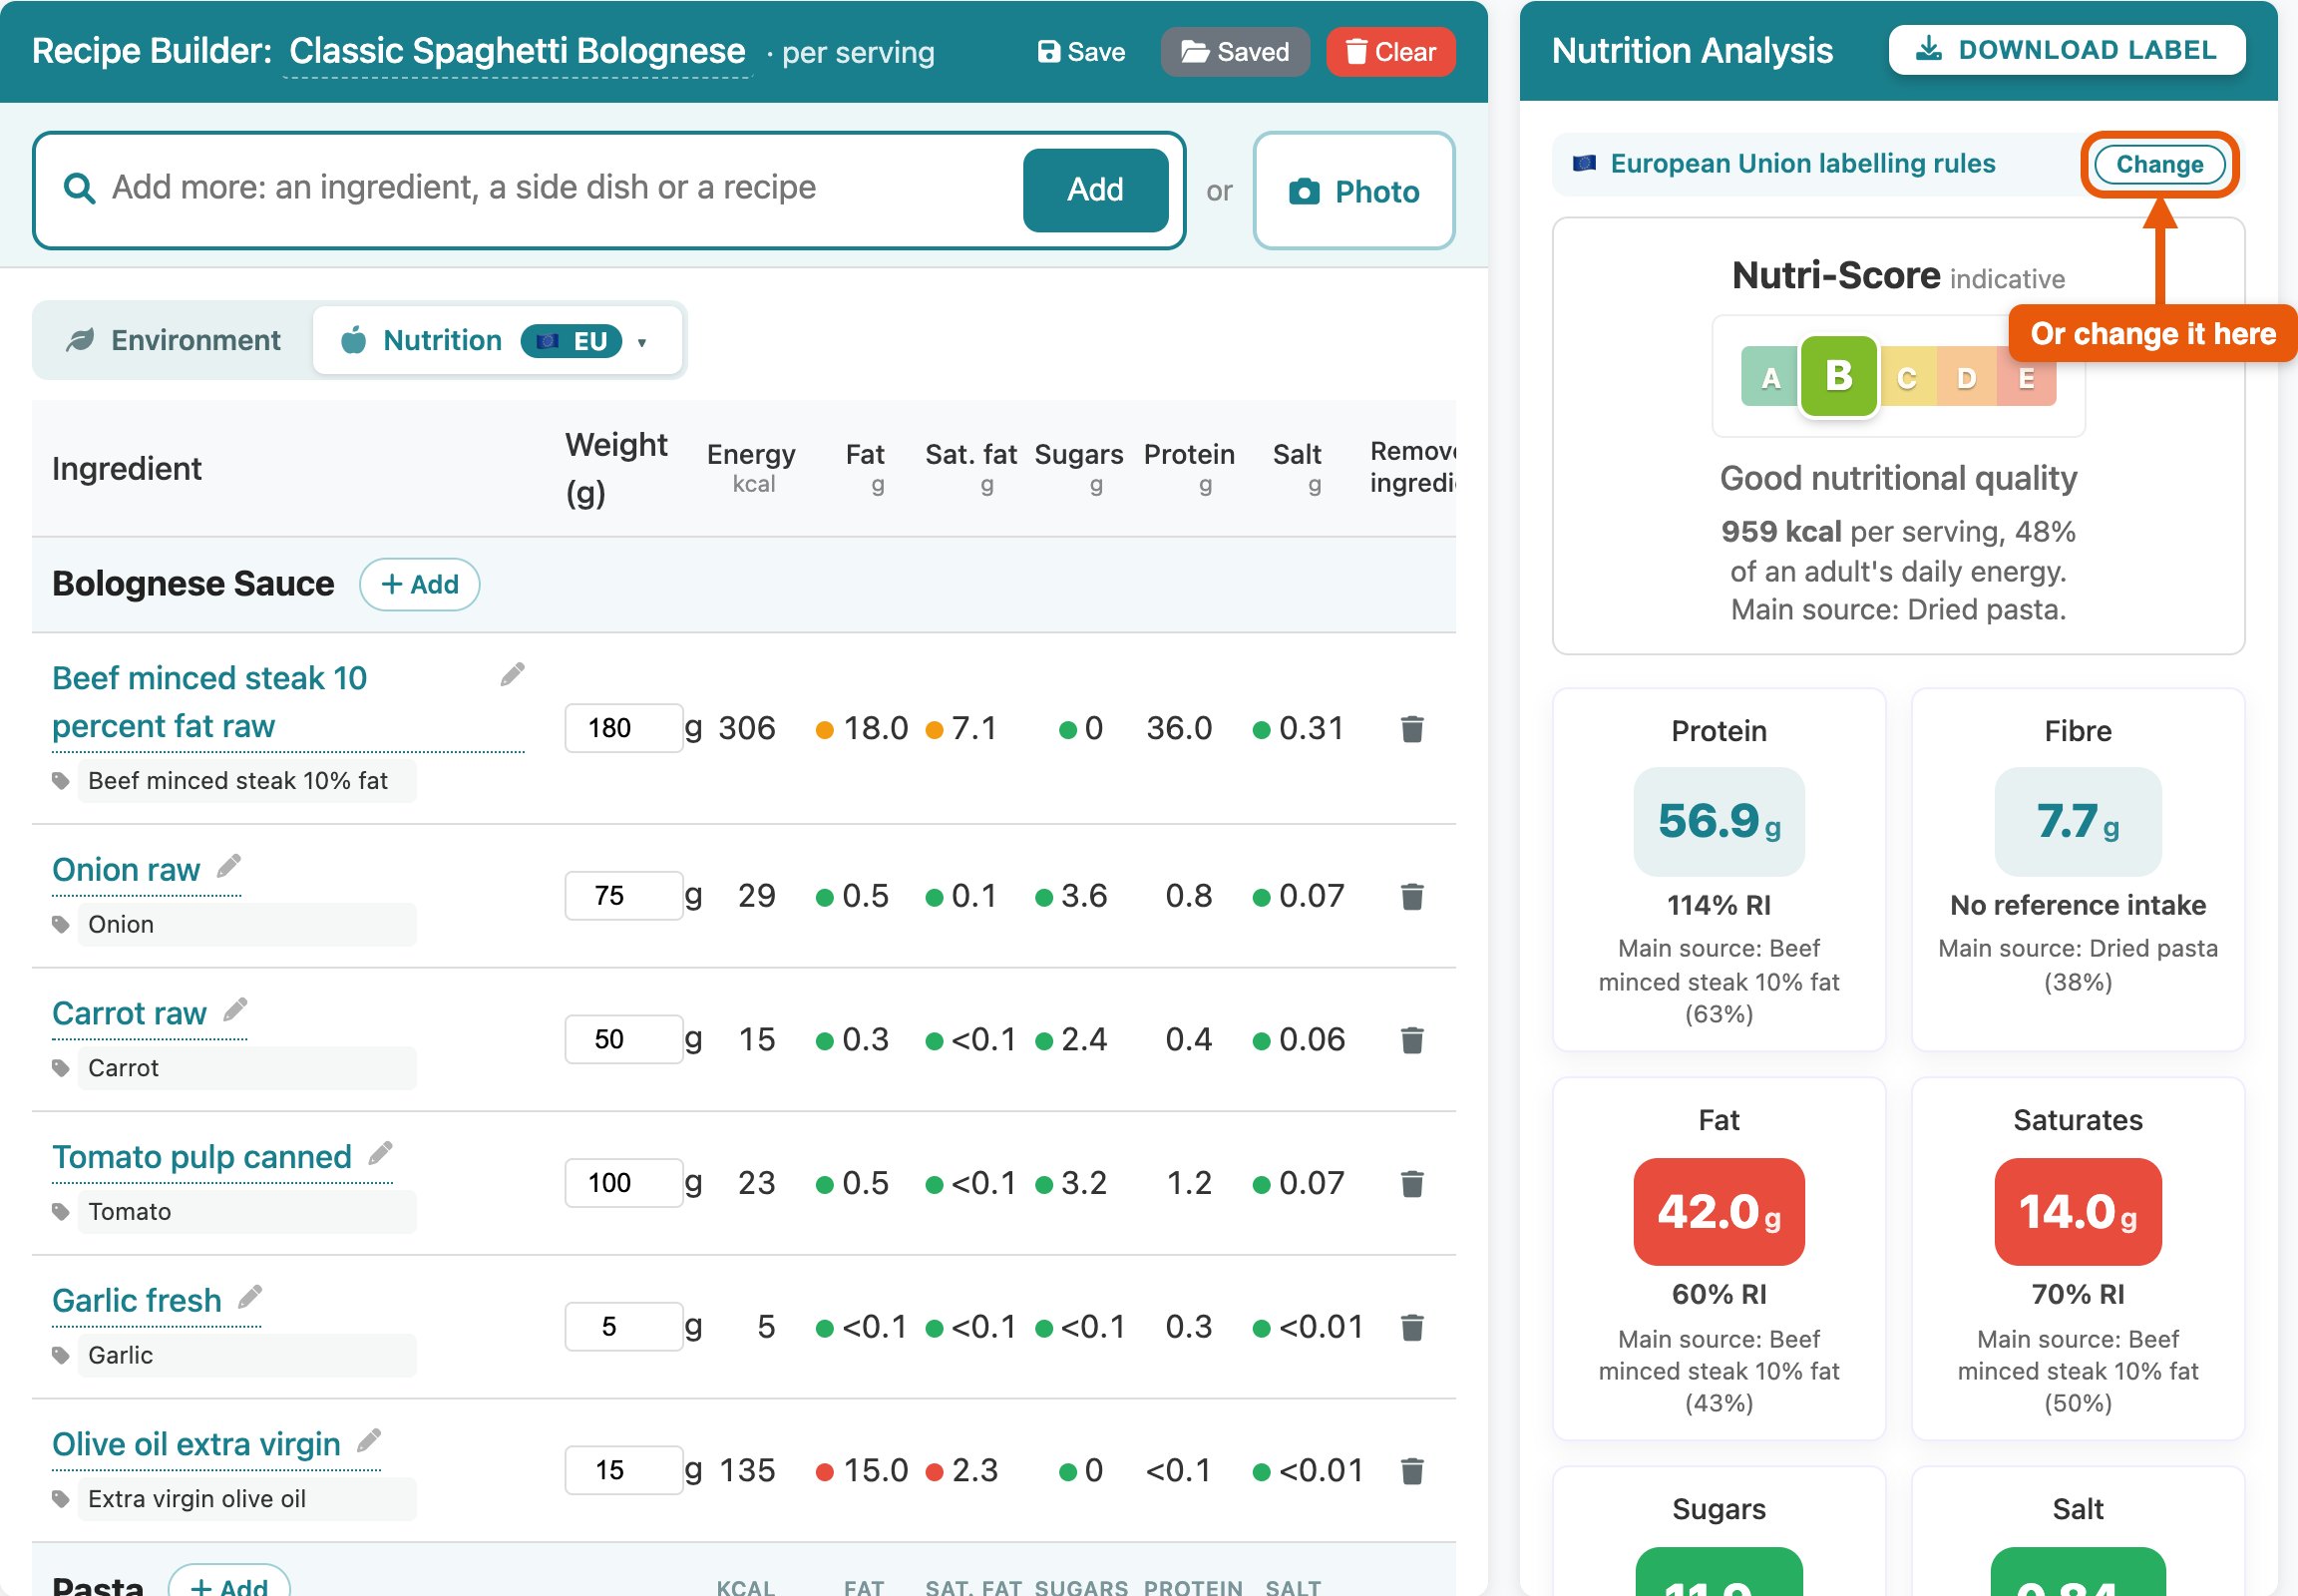
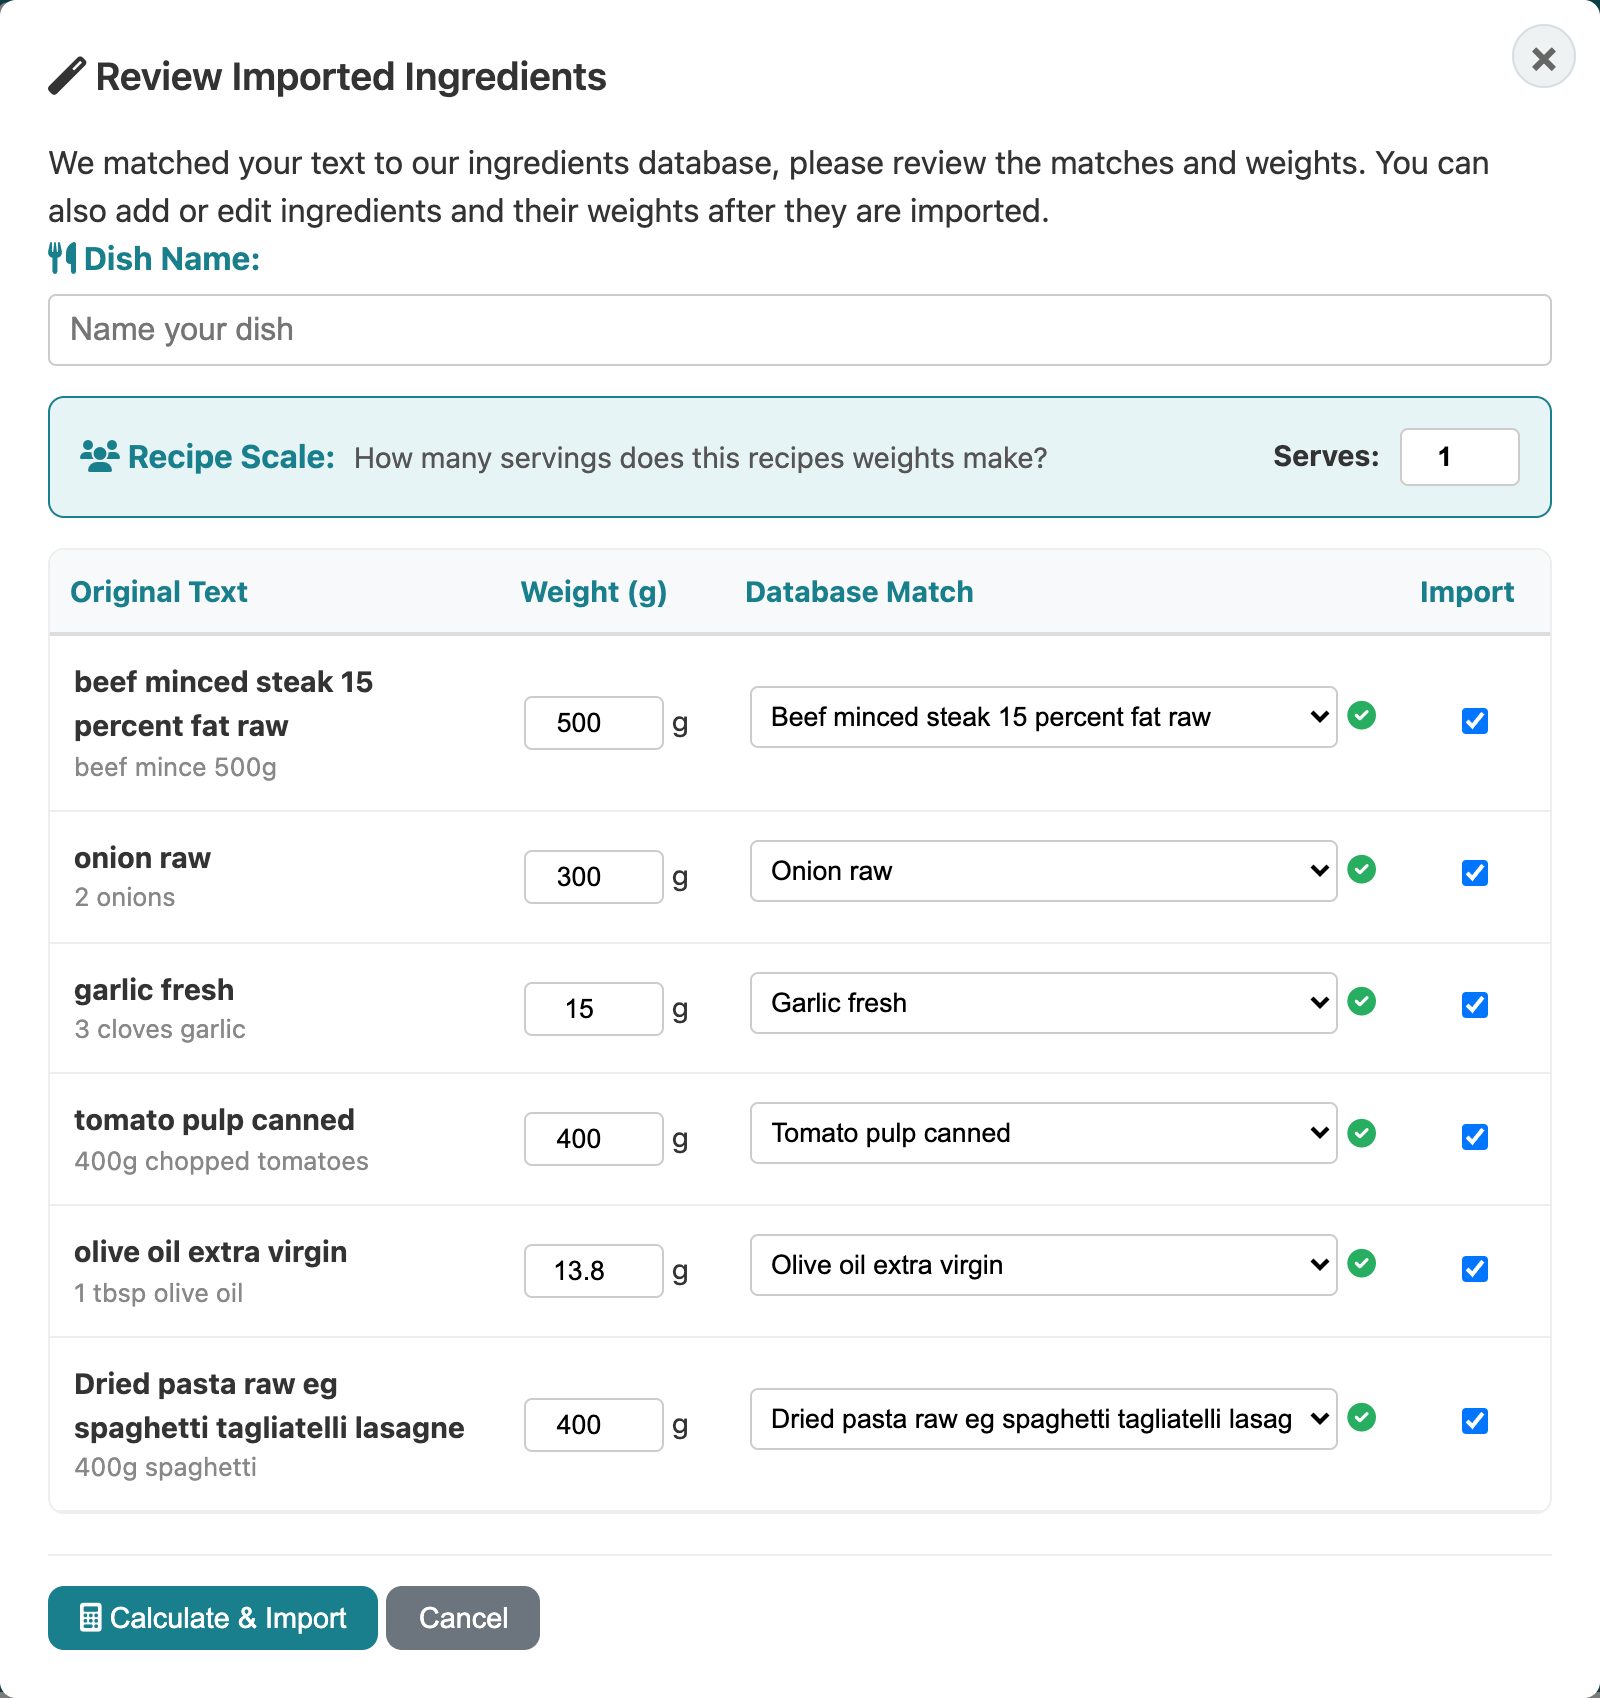
Type a dish name and AI suggests ingredients and weights. Or paste a recipe, photograph a menu or import a spreadsheet from your costing software.

AI-suggested ingredients and weights
2

See what drives each grade

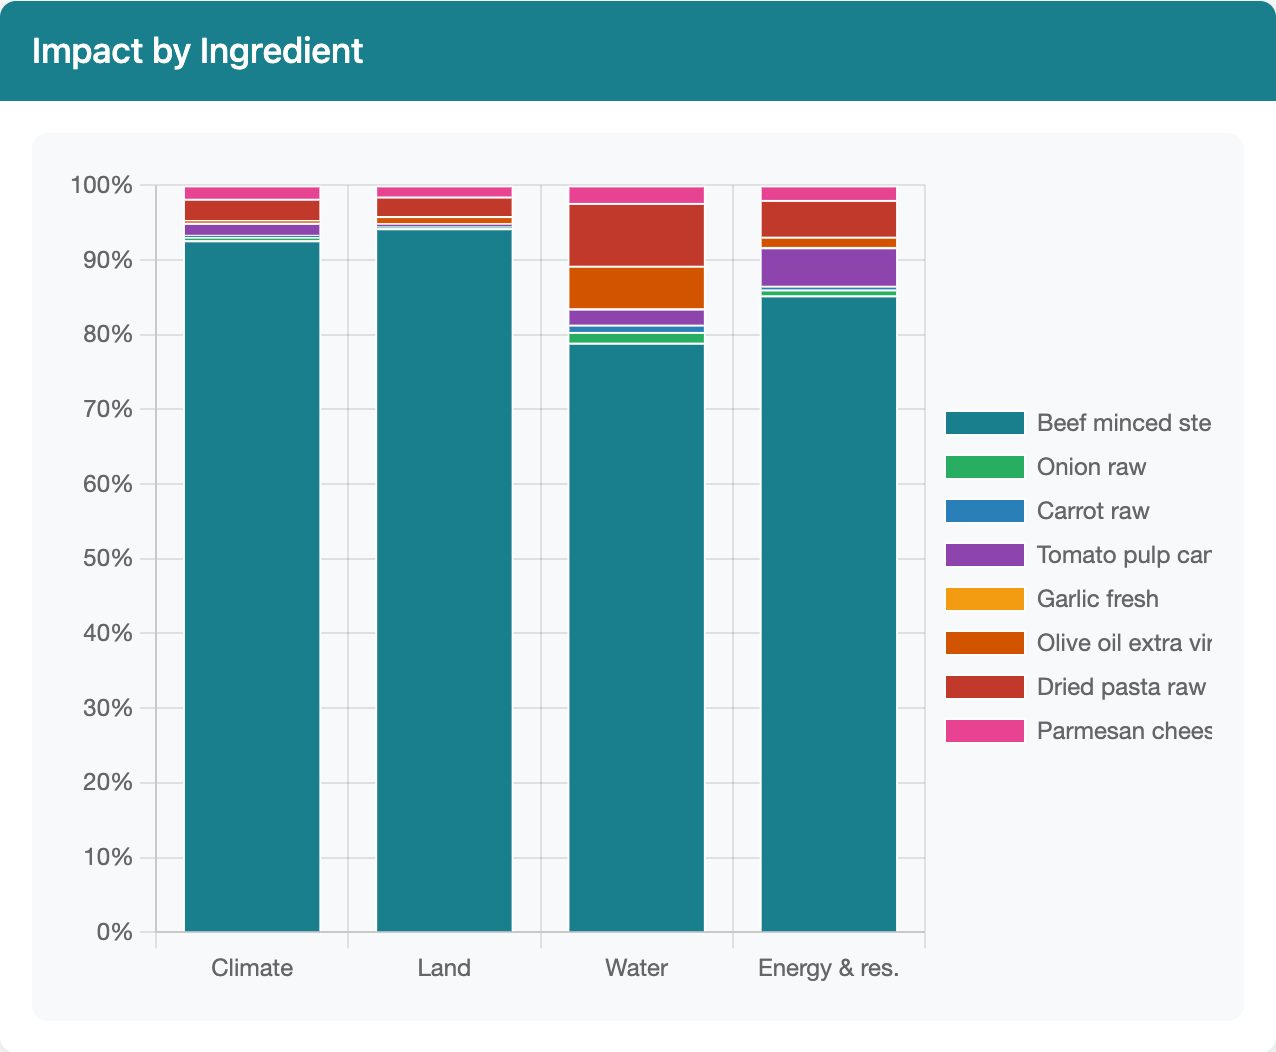
Traffic-light dots for climate, land, water and resources on every ingredient, plus each one’s share of the dish’s impact.

Impact share by ingredient
3

Label, compare and report

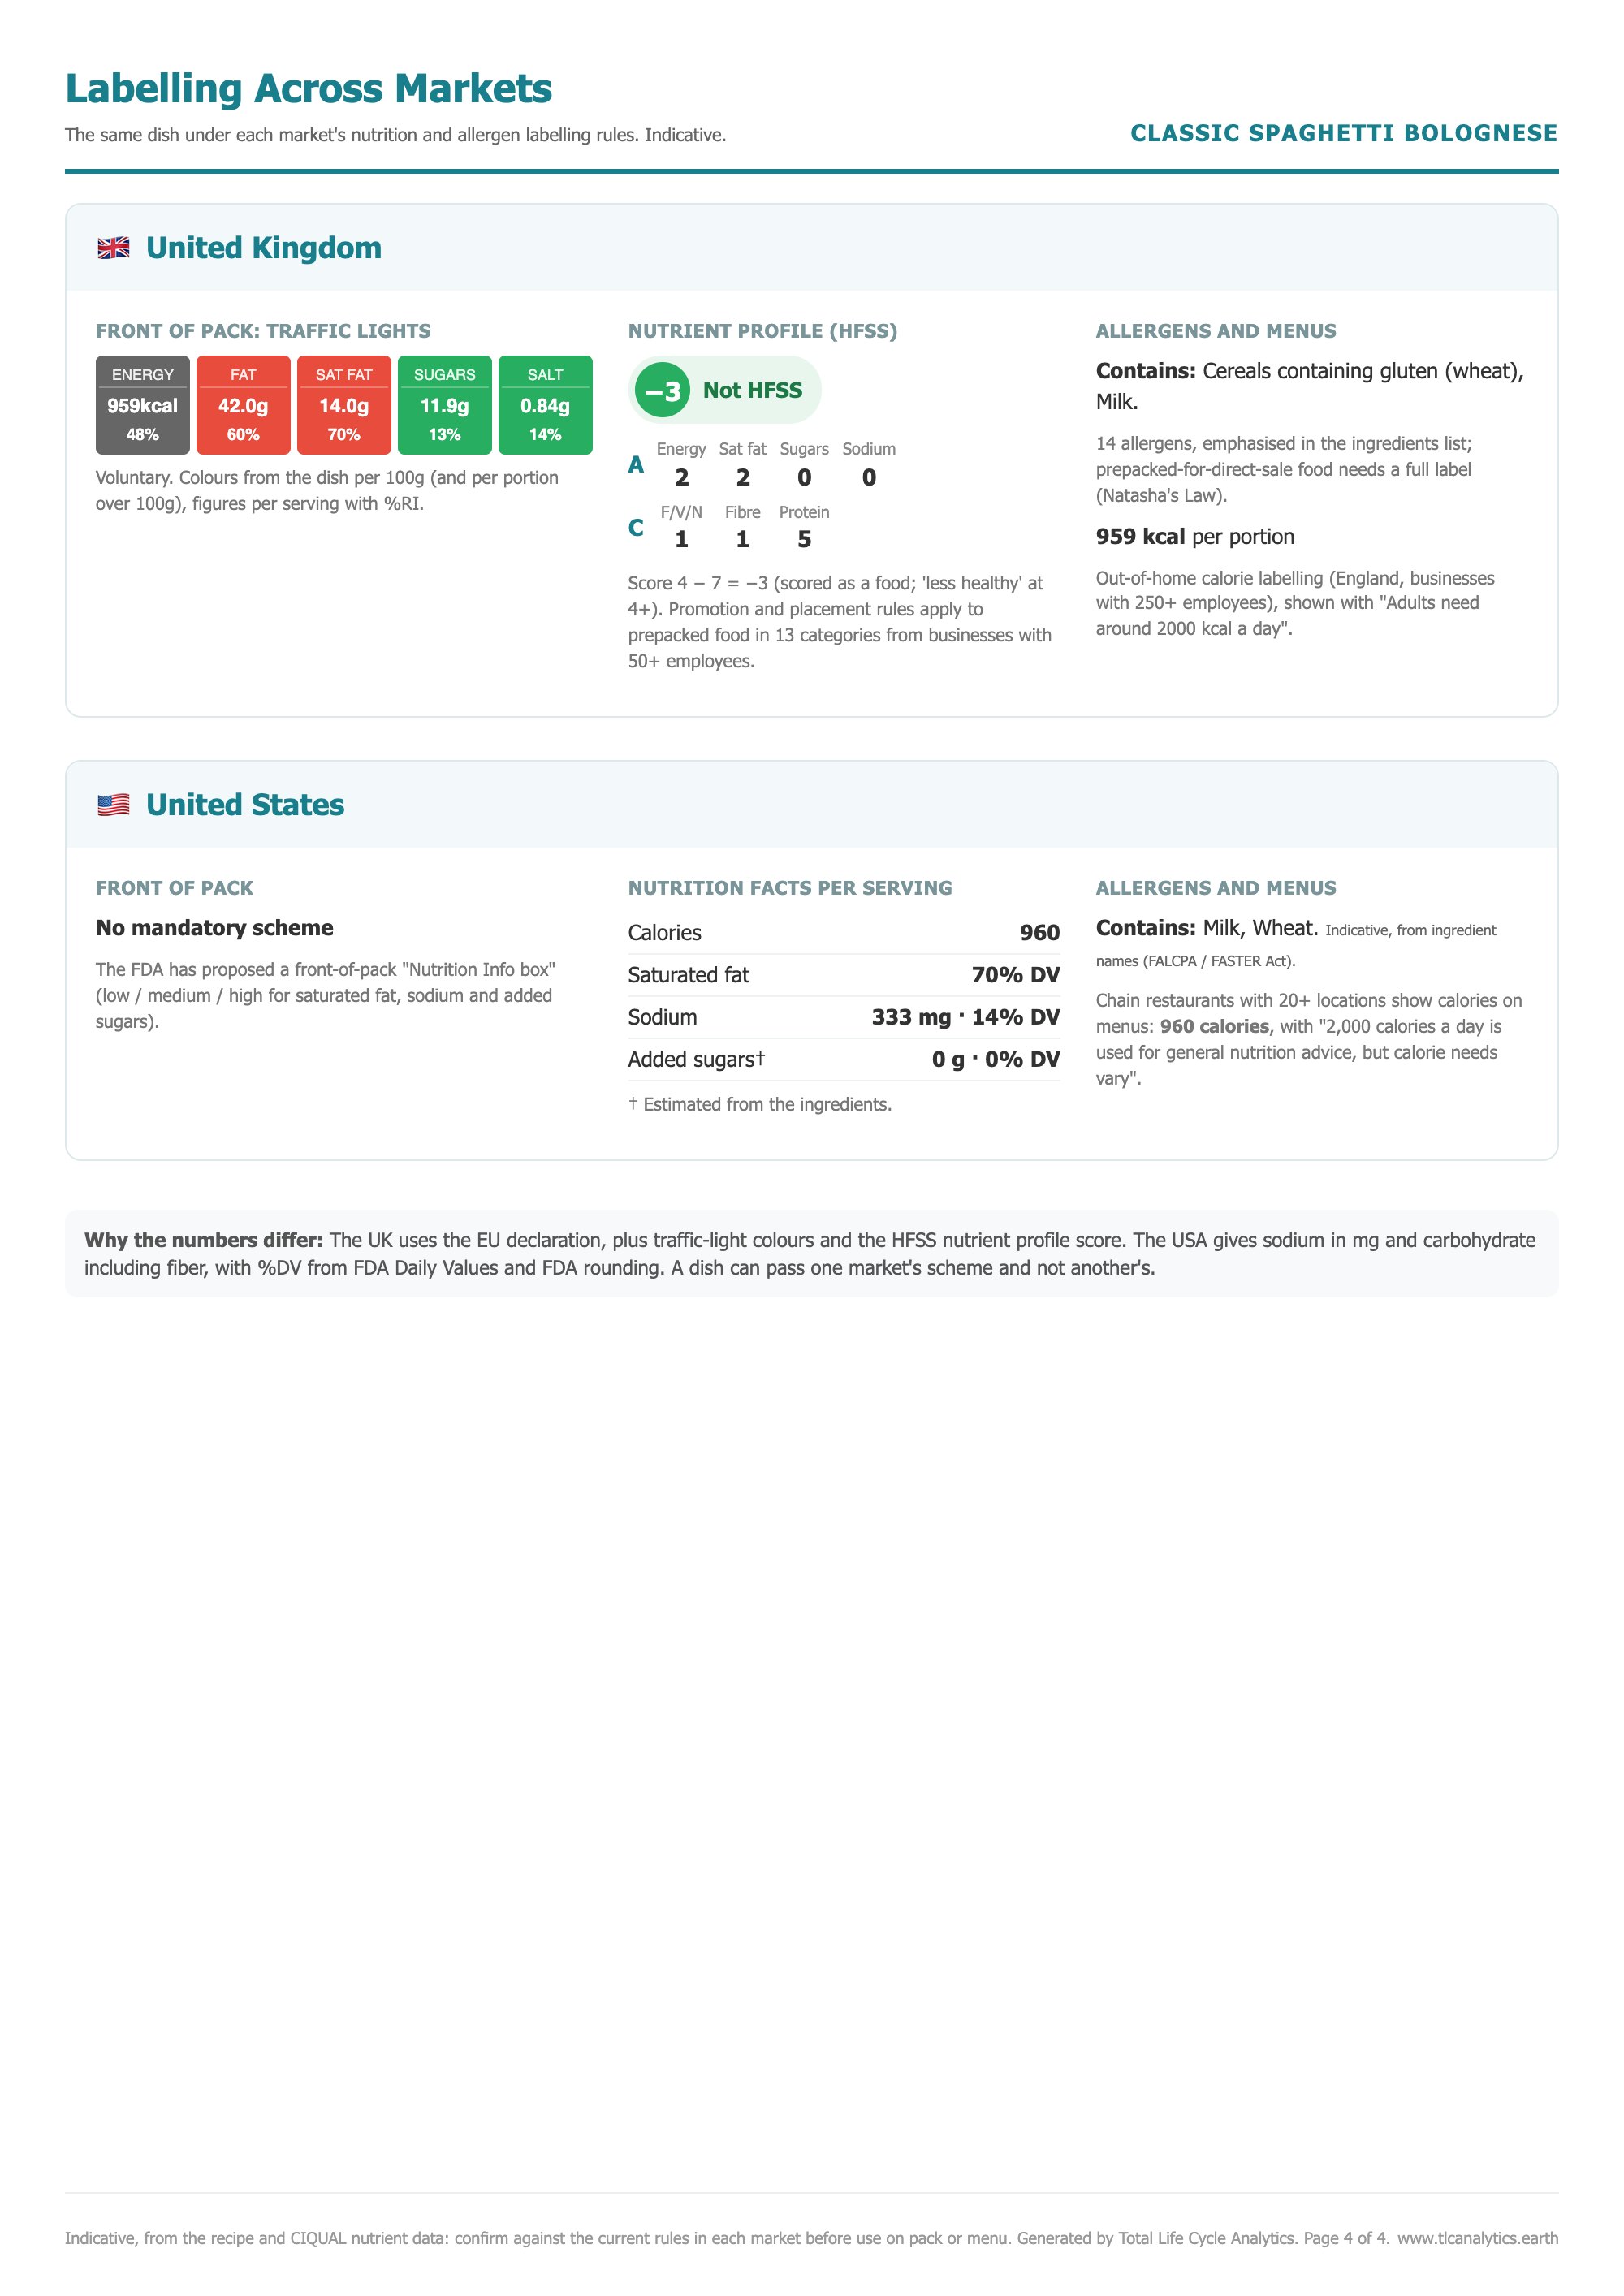
Download menu labels with allergens and nutrition. Pro adds full certificates and data exports.

Downloadable dish label
Planet and P&L

Lower impact and a healthier margin.

Add cost and menu price to see gross profit next to every grade. Menu Overview ranks dishes by kg CO₂e per £1 of gross profit, so you can spot the dishes that cost the planet more than they earn. In this example, Hearty Lentil Soup has the lowest carbon and the highest GP.

Menu Overview comparing grades, cost and gross profit
On the menu

Labels guests understand, backed by full data.

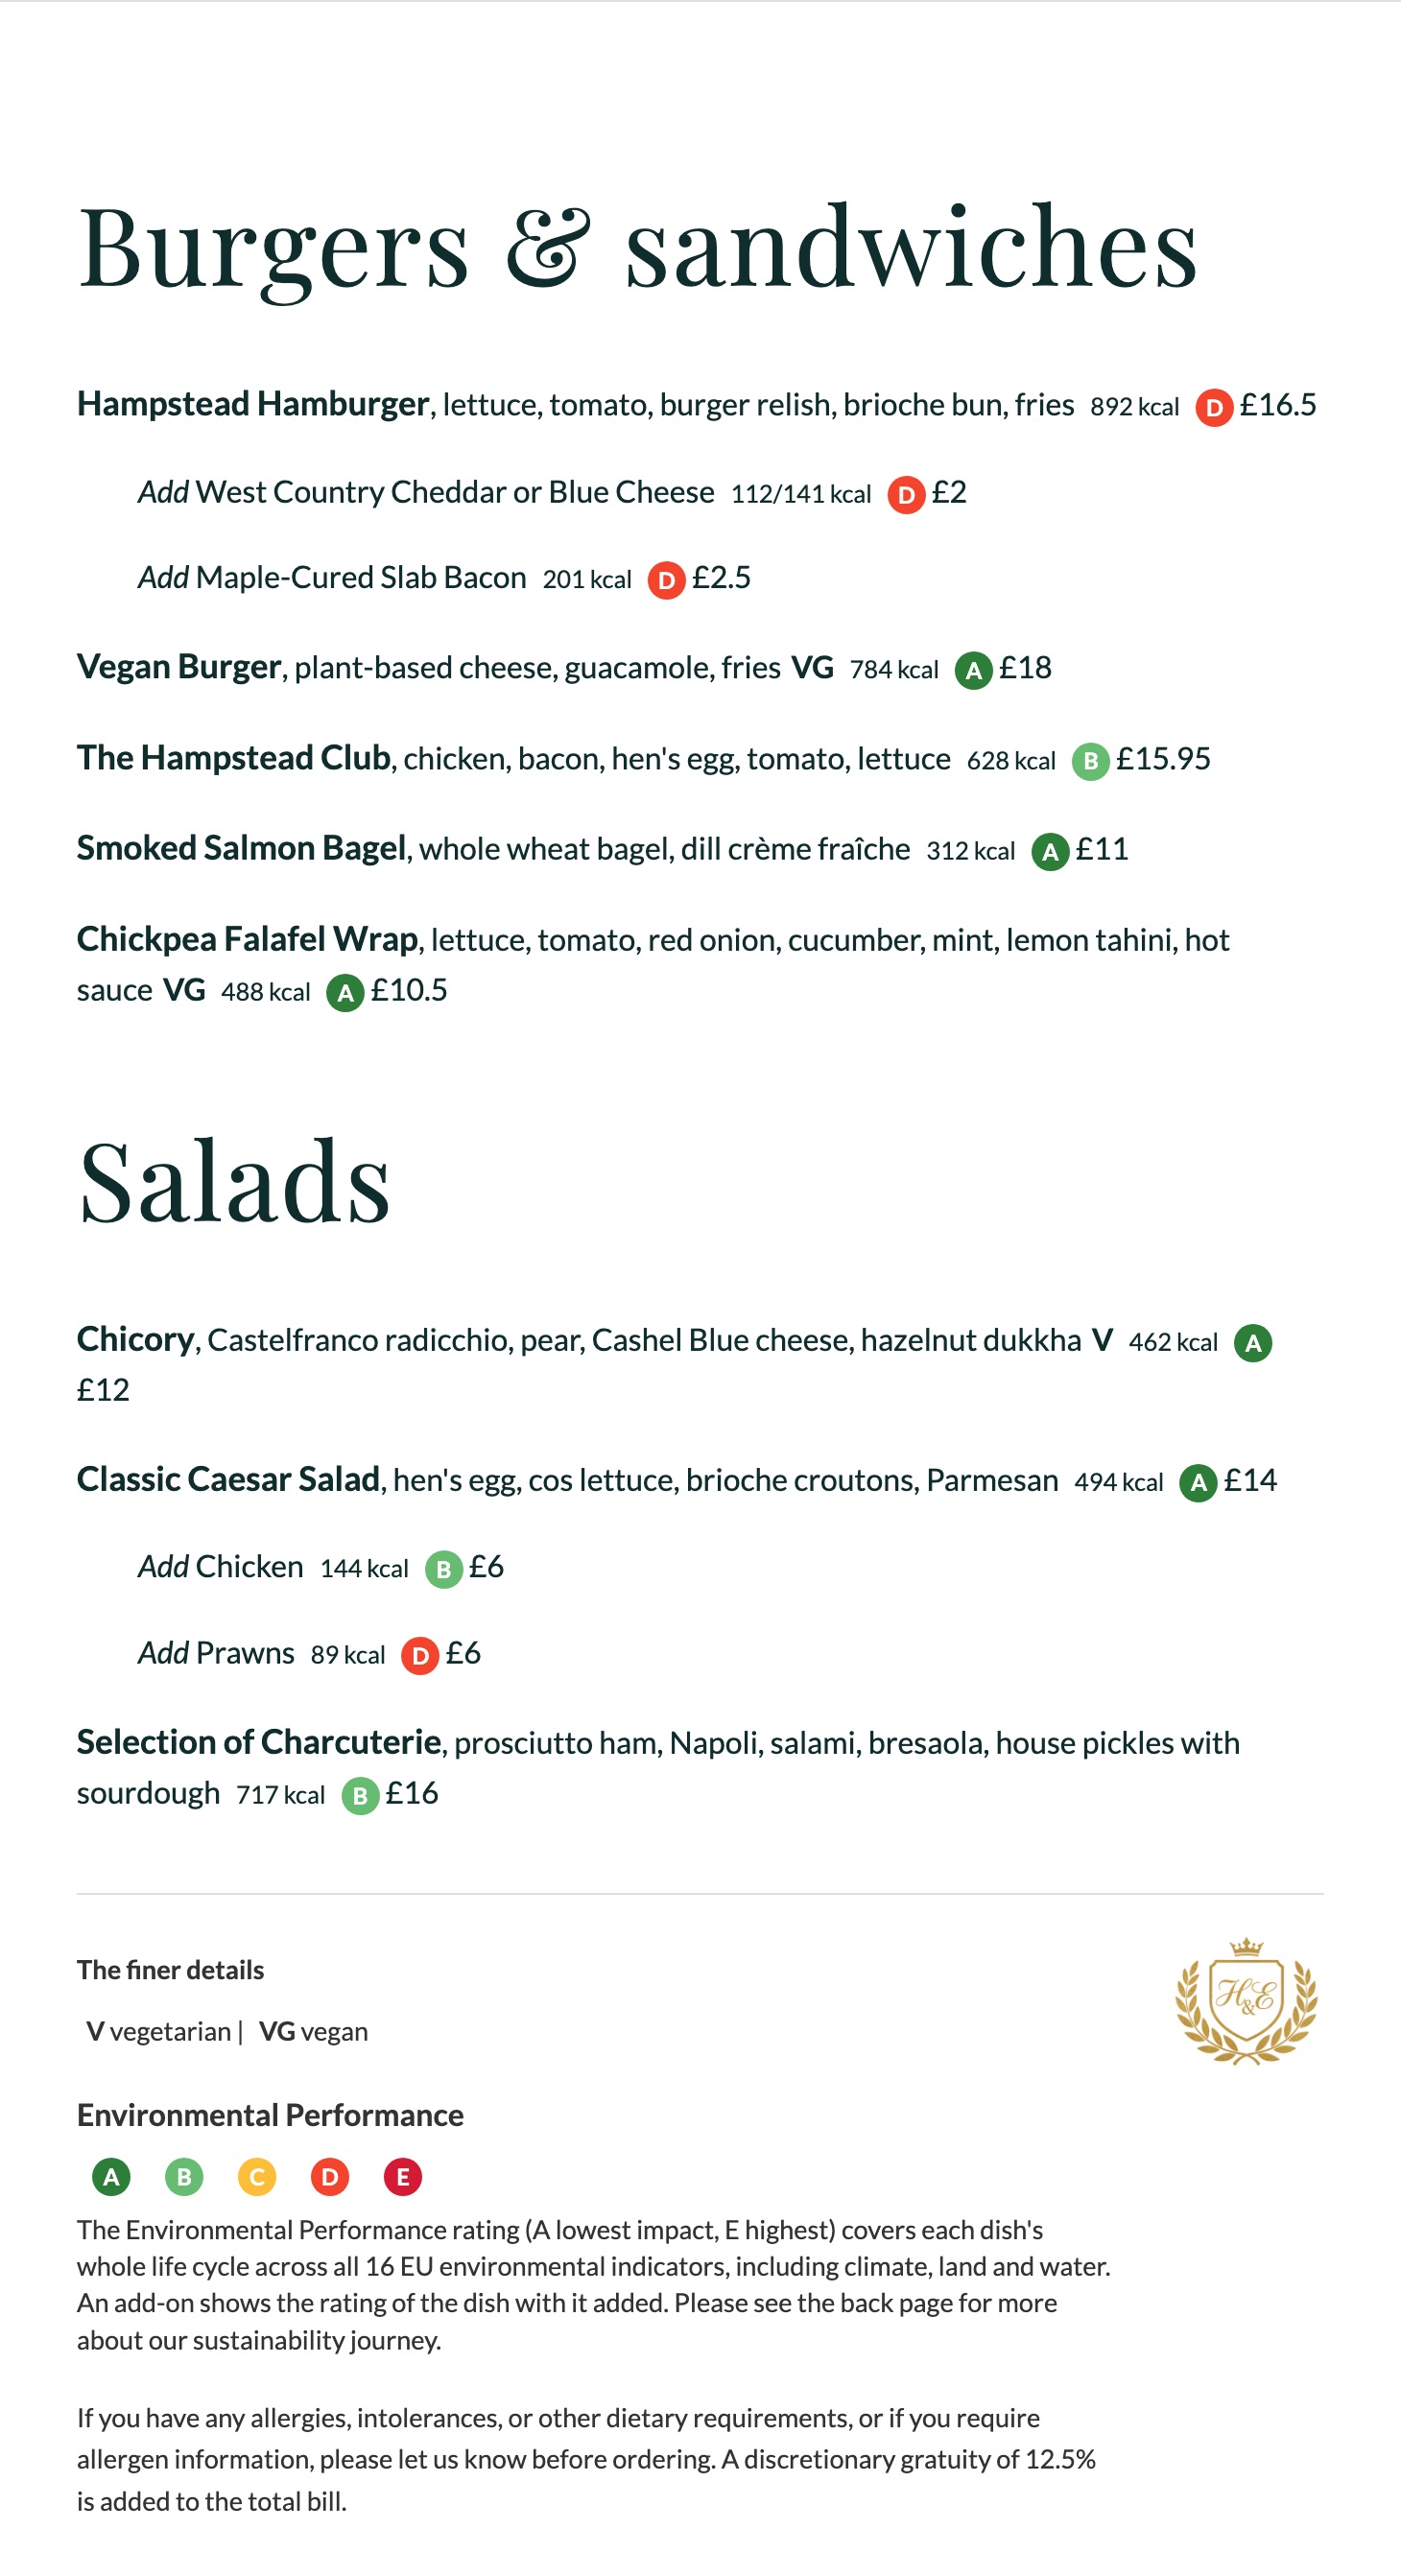
One small A–E badge next to the price and calories, like this live example menu. Behind every badge sits a full label with climate, land and water grades, ingredients, allergens and nutrition. See the menu

  • Guests respond: showing environmental information on menus shifts choices towards lower-impact dishes (Appetite, 2025).
  • Hotels are already doing it: Hilton carbon-labelled menus across almost 30 UK hotels, and low and medium-impact dishes made up over 85% of its autumn 2023 menu (Hilton, Oct 2023).
  • Go one step further: most menu labels show carbon only. A CHEF label also grades land and water.
Restaurant menu with an A–E environmental grade and calories beside each dish, and a key explaining the rating covers all 16 EU indicators including climate, land and water

In support and alignment with

Greenhouse Gas ProtocolGHG Protocol Scopes 1, 2 & 3
Glasgow DeclarationGlasgow Declaration signatory
UN Environment ProgrammeModelled in line with UNEP research
UNFCCCUNFCCC Climate Change Pledge

Data: Agribalyse 3.2 · Ciqual 2025 · EU Environmental Footprint 3.1

Pricing

Free to start. £21 for the full picture.

CHEF LiteFor chefs testing dishes and labels
£0
Free account needed only to download labels
  • Overall A–E grade + Climate, Land, Water, Energy & resources
  • EU nutrition table and indicative Nutri-Score
  • Ingredient list with allergens in bold
  • Downloadable A–E menu labels
Start free
CHEF ProFor F&B managers and reporting
£21
One payment, 12 months. No auto-renewal.
  • Everything in Lite
  • Full figures for all 16 PEF indicators per dish
  • 57 nutrients incl. vitamins and minerals
  • Indicative labels for 10 markets, incl. UK HFSS
  • PDF certificates and ingredient data CSV
Get Pro
TLC CertifiedWhole-property assessment, done for you
from £350
Venues under 50 staff. Larger hotels by quote.
  • Everything in Pro
  • TLC analysts review menus, bills, water and sourcing
  • Scope 1, 2 & 3 footprint (GHG Protocol)
  • Biodiversity and plastics assessment
  • TLC Certified badge for guests
Talk to us
Hotel group or multi-site? We can set up Pro for your whole team on one invoice.Contact us →
Questions

Before you start

Why go beyond carbon?

Carbon has the biggest single weight in the EU method, but it is only about a fifth of the total. Land, water and nutrient pollution make up much of the rest, and they are where farming does most harm to nature. A dish can be low-carbon and still score badly on land or water. CHEF shows both.

Can I grade a buffet or banqueting menu?

Yes. Enter each dish at the average portion per guest, then save the menu and compare it in Menu Overview. Set menus can be shared as labels or Pro certificates.

Does it work for our Scope 3 report?

CHEF gives kg CO₂e per serving for every dish. Multiply by covers to estimate purchased-food emissions, or ask TLC for a full GHG Protocol assessment of the property.

Are the labels legally compliant?

Nutrition labels are indicative, calculated from ingredient data. Allergens are read from ingredient names. Always confirm with supplier specifications before use.

How accurate is the grade for local produce?

Grades use Agribalyse 3.2 average data for each ingredient, plus origin choices for beef and lamb. They are best for comparing dishes and swaps. For a specific farm, combine CHEF with your supplier’s own data. Full FAQ

How does your menu score on climate, land and water?

Find out in under two minutes. Free, no sign-up to start.

CHEF is also for

Sustainability reportingScope 3 Food Emissions & Nature DataStudents & lecturersFree Food Sustainability Tool for Students
CHEFCalculator for Health, Environment and Food

Free A–E grades for climate, land and water from all 16 EU PEF indicators, with nutrition and allergens.

Who it’s for

Using CHEF

TLC Analytics