Free professional tool — no sign-up required
Amateur foodies also welcome — just type in a dish name and get results

Great ingredients.
Proven impact.
Premium hospitality.

The only tool that scores and labels every dish on both environmental footprint and nutritional value. Giving health-conscious guests the transparency that they expect from quality hospitality.

2,800+
ingredients &
dishes in database
145
countries using
the tool
580k
LCA data variables
underpinning results

We have worked with leading hospitality and travel organisations

Food is your largest controllable environmental impact - and your guests want you to act.

F&B operations can generate over 50% of on-site hospitality and hotel emissions. The effects span climate, water and biodiversity, and they are measurable, actionable and communicable to your guests today.

SDG Climate Action

Climate & greenhouse gases

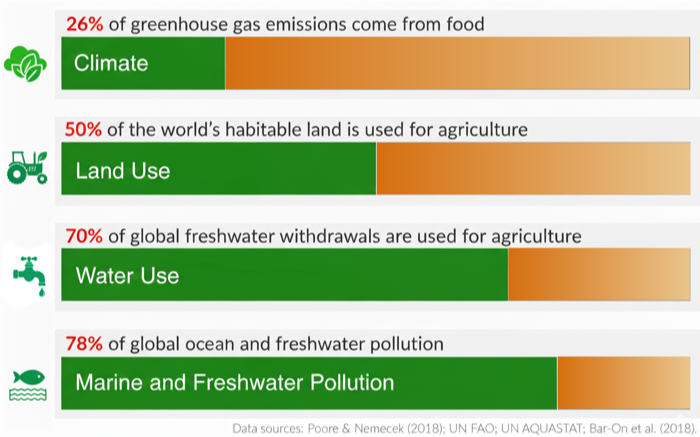
Food systems are responsible for 26% of all global greenhouse gas emissions. Livestock supply chains dominate. Your menu is the most direct and effective way to change your impact on the climate.

26%
of global GHG emissions come from food systems
SDG Life below Water

Water & land biodiversity

70% of global freshwater extraction and 78% of ocean and freshwater pollution is linked to farming. Land conversion for agriculture is the single largest driver of biodiversity loss.

70%
of freshwater extraction is from agriculture
SDG Life on Land

Guest expectations & health

A PwC survey of 20,000 consumers across 31 countries found that 44% would pay a premium for more sustainable food. Nutrition transparency is now an equally powerful demand signal.

44%
of consumers will pay more for sustainable food
GHG Protocol Scope and Category Emissions breakdown of a large European 5-star hotel spa resort, showing Food and Beverage accounting for 49% of emissions.

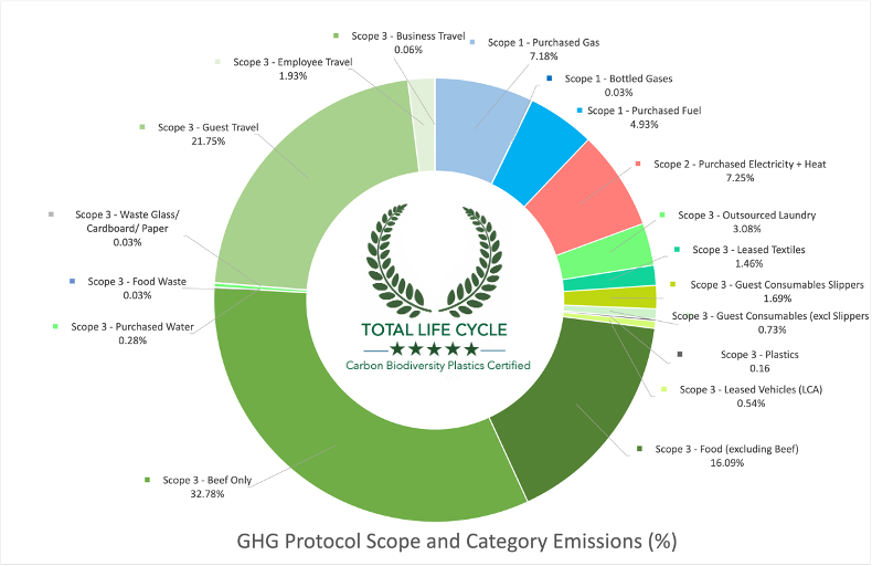
Certified European 5-star resort — F&B accounted for 49% of total on-site emissions.

In practice, F&B consistently outweighs every other on-site emission source — more than electricity, heating and waste combined. Unlike infrastructure upgrades, menu changes can reduce your footprint this season.
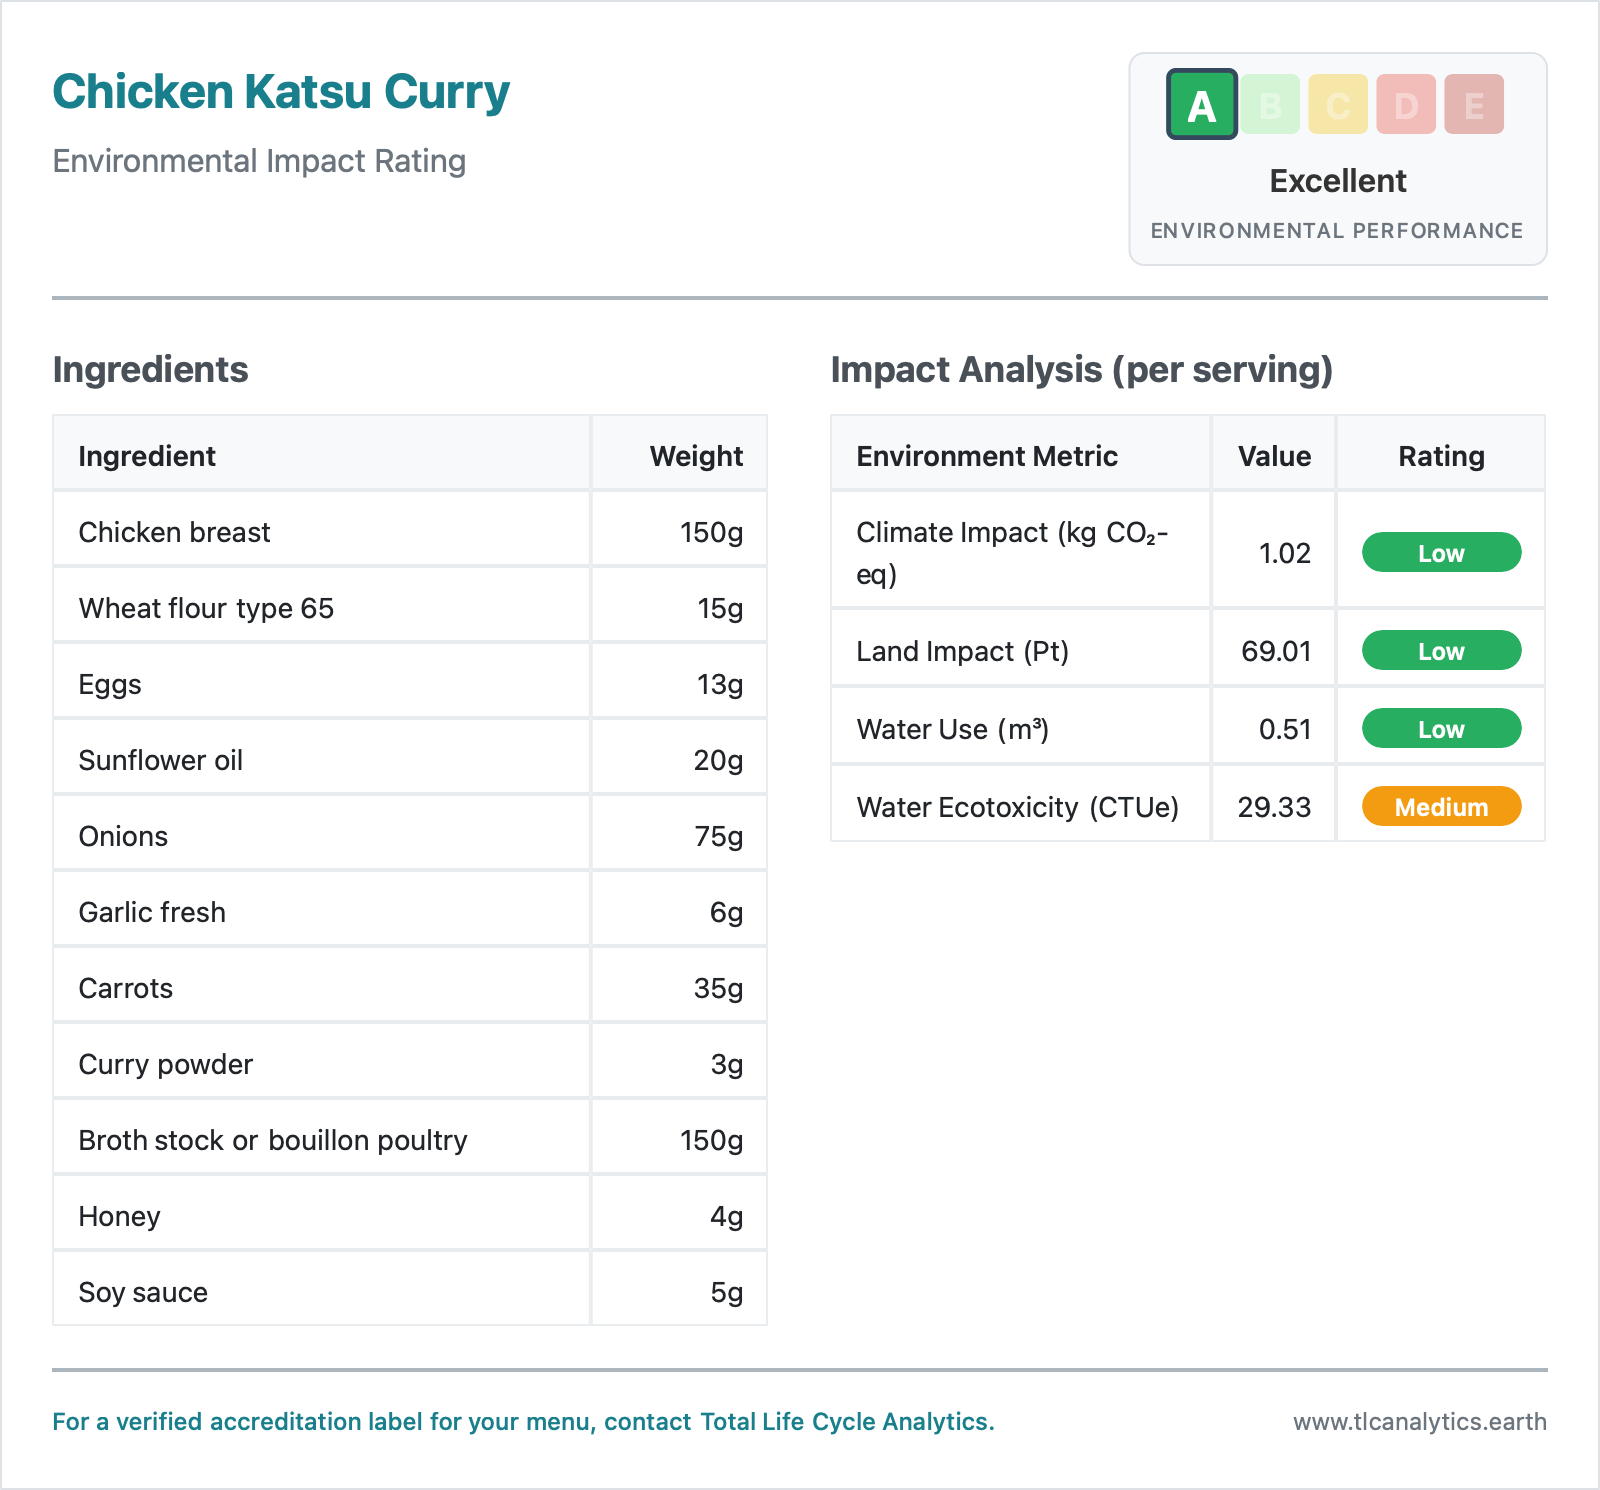
Start measuring your menu
Restaurant menu showing A-E environmental performance ratings for each dish

Empower guests with simple menu ratings (see live example), backed by detailed, transparent data.

Measure, compare and label — in minutes.

Search from 2,800+ ingredients, build your dish, adjust portion size and instantly get science-backed A–E environmental grades plus its nutrition profile. Generate labels you can display on your menu with confidence.

When environmental information appears on menus, academic research and hotel groups including Hyatt and Hilton have demonstrated that guests consistently choose lower-impact options.

  • Open accessno sign-up or monthly subscription required to start
  • Science-based580,000+ LCA variables across all 16 PEF categories
  • Visual recipe galleryjump straight in with pre-built example dishes
  • No recipe - no problemjust type in a dish name or upload a photo of the menu and AI automatically finds ingredients and weights
  • Globally trusteddishes assessed in 145 countries
Launch the free calculator
Chart showing the environmental impact of food on climate, land use, water use, and marine and freshwater pollution. Source: Our World in Data.

Carbon is only part of the story.

Our most immediate environmental challenges are climate change and biodiversity loss — and they are inseparable. Focusing on carbon emissions alone misses 70% of freshwater extraction, ocean pollution, land degradation and species loss that farming drives.

To make truly sustainable choices for your business and your guests, it is essential to consider the full picture of climate, land, and water impacts together. That is what the EU’s Product Environmental Footprint (PEF) standard — which we use — was designed to do.

“Chefs really care about the environment because good quality dining comes from sourcing excellent ingredients. A good chef rises to the challenges and enjoys the creativity needed to deliver a truly engaging dining experience that also takes better care of nature.” Chef Monty — Sahana Restaurant and Bar

All 16 Product Environmental Footprint categories — not just carbon.

The EU’s PEF standard defines 16 environmental impact categories. We cover all of them — from climate change to marine eutrophication — so your sustainability reporting is comprehensive, credible and comparable.

Climate
Water
Land
Human health
Climate change
GHG emissions
Ozone depletion
Stratospheric
Human toxicity
Cancer & non-cancer
Particulate matter
Respiratory effects
Water scarcity
Freshwater use
Marine eutrophication
Ocean nutrient load
Freshwater eutrophication
River & lake pollution
Ecotoxicity — freshwater
Aquatic life impact
Land use
Biodiversity impact
Land transformation
Habitat conversion
Ionising radiation
Human health
Photochemical ozone
Smog formation
Acidification
Soil & water pH
Resource use — energy
Fossil depletion
Resource use — minerals
Material scarcity
Respiratory inorganics
Air quality

57 nutritional indicators — not just calories.

The modern diner isn’t just looking for a low-carbon meal. They want to know what’s in their food. Our Professional tier unlocks the most comprehensive nutritional database available for F&B operations, fully aligned with EU labelling requirements.

Balance your menu’s environmental grade with its health profile. Meet corporate wellness goals, respond to dietary preferences and build genuine guest trust.

Energy, carbohydrates & sugars
10 indicators
Fatty acids & cholesterol
12 indicators
Minerals & salts
16 indicators
Vitamins
19 indicators
Roasted Peking Duck — per serving
Full nutrition breakdown (57 indicators in Pro)
Energy
573 kcal
Protein
32.0 g
Carbohydrates
16.1 g
Of which sugars
10.9 g
Fat
46.0 g
Saturated fat
14.2 g
Fibre
1.1 g
Salt
2.22 g
Environmental impact (per serving)
Climate1.44 kg CO₂e
Land Bio80.58 Pt
Water Use0.63 m³
Ecotox50.52 CTUe

Used by hospitality professionals in 145 countries.

From five-star hotel groups to independent restaurants, TLC Analytics is the tool the industry relies on for credible sustainability data.

★★★★★
“Chefs really care about the environment because good quality dining comes from sourcing excellent ingredients with great texture and taste. A good chef rises to the challenges and enjoys the creativity needed to deliver a truly engaging dining experience that takes better care of nature.”
Chef Monty
Sahana Restaurant and Bar
★★★★★
“Until we got in Total Life Cycle we did not comprehend that the largest reduction in on-site emissions in the shortest time could be through adjusting our menus. F&B was over 50% of our hotel spa’s footprint — their tool made the process easy and manageable.”
Managing Director
European 5-star Resort
★★★★★
“When environmental information appears on menus, guests consistently choose lower-impact options. The labelling has become a genuine point of difference for us — guests notice and appreciate the transparency.”
Sustainability Manager MENA
Grand Hyatt
Research & evidence

“When environmental information on menus is provided, peer-reviewed academic research and hotel groups such as Hyatt and Hilton have demonstrated that guests choose less nature-harming options.”

“A PwC consumer survey across 31 countries (20,000 respondents) reports that 44% of consumers would pay a price premium for more sustainable foods.

145
countries where dishes
have been assessed
2,800+
ingredients and dishes
in the database
£0
to use the core calculator —
no sign-up required

Start free. Go deeper when you’re ready.

The core calculator is always open access. Unlock the full picture with a Pro report, or let our analysts certify your whole establishment.

Free forever
Open Calculator LITE
£0
No sign-up. No time limit. Always.
Environmental grading for any dish across Carbon, Water use, Water ecotoxicity and Land ecosystem impacts, 4 of the 16 EU PEF environmental indicators
2,800+ ingredient database with full LCA data
6 core UK/EU standard nutrition values — label-ready
A–E environment dish labels you can display on your menu
Visual recipe gallery for instant comparisons
Pro — Self-Service
Full PRO Report
£21
48-hour certificate labels & indicators
Everything in Lite, plus:
All 16 EU compliant PEF environmental indicators — complete lifecycle picture per dish
Full 57 nutritional indicators per dish including vitamins & minerals
Certified UK/EU compliant nutritional labels ready to print
Downloadable full report — shareable PDF for your team, guests or investors
No TLC site audit — you run the calculator yourself
Done For You
TLC Certified
From £350
For venues with fewer than 50 staff
Everything in Pro, plus:
We do it for you — TLC analysts review your bills, menus, water & sourcing data
Whole-establishment CO₂ & biodiversity audit — Scope 1, 2 & 3 (GHG Protocol aligned)
Third-party LCA certification — science-verified with TLC Certified badge
Plastic & biodiversity assessment beyond F&B operations
TLC Certified 5-star badge

How it works: video tutorial

See how to build a recipe, analyse its full environmental impact and find sustainable alternatives — in just a few minutes.

Watched the tutorial and ready to go?   Launch the Food Calculator →

In support and alignment with

Greenhouse Gas Protocol

We follow the GHG Protocol Standards for Scope 1, 2 and 3 emissions measurement.

Glasgow Declaration on Climate Action in Tourism

TLC is a signatory of the Glasgow Declaration on climate action in tourism.

UN Environment Programme

Environmental impacts modelled in alignment with UNEP research.

UN Framework Convention on Climate Change

TLC is a signatory of the UNFCCC Climate Change Pledge.